29
/
en
AIzaSyAYiBZKx7MnpbEhh9jyipgxe19OcubqV5w
April 1, 2024
126612
El Salvador
SLV
true
2
1
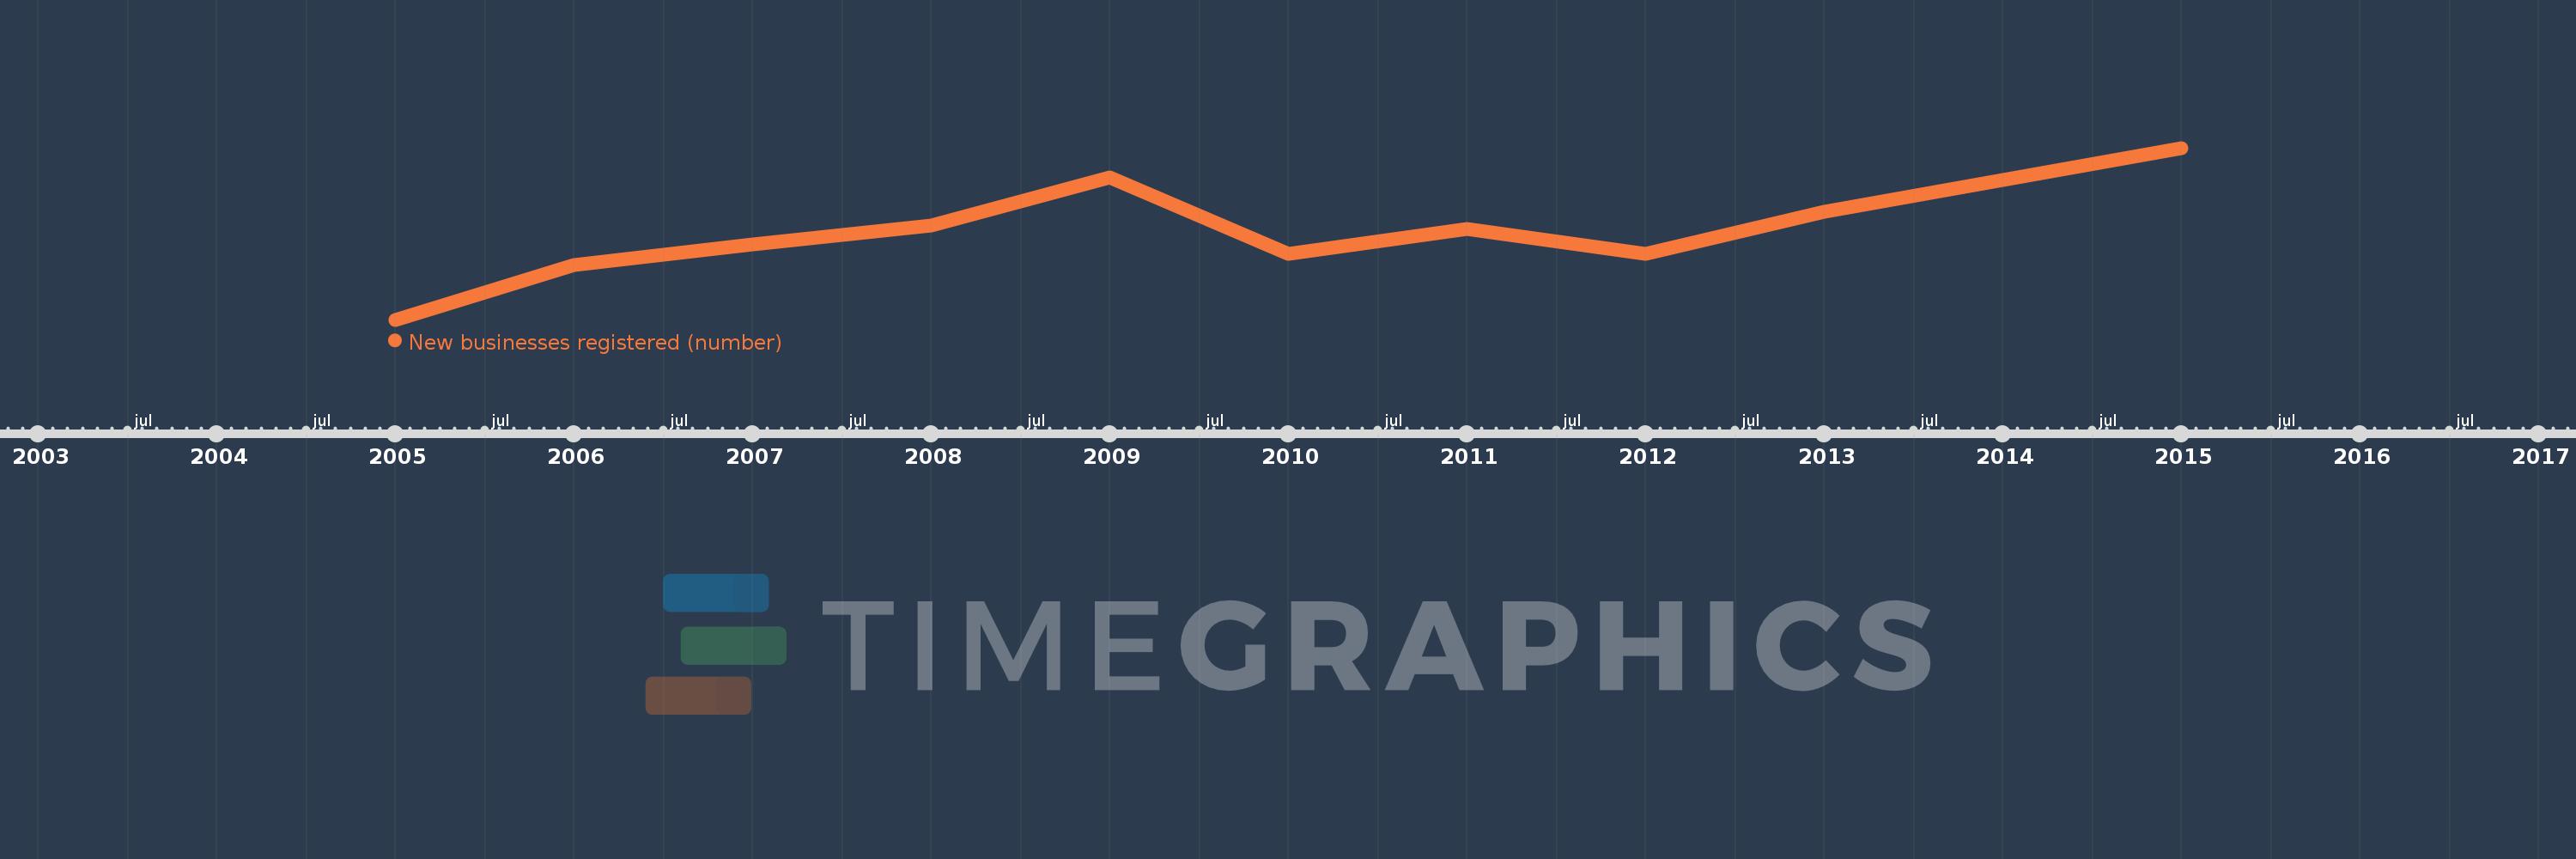
New businesses registered (number)
2015,2013,2012,2011,2010,2009,2008,2007,2006,2005
This statistics in other country:
Timeline:
This timeline shows a graph from 2005 to 2015 of El Salvador. No data until 2004. Number of actual observations by date: 10.
Source name:
World Development Indicators
Source organization:
World Bank's Entrepreneurship Survey and database (http://econ.worldbank.org/research/entrepreneurship).
Categories, topics:
Private Sector
Last updated:
apr 23, 2017
Indicators value changes by year
Minimum:
1.536K
jan 1, 2005
Maximum:
2.104K
jan 1, 2015
At the date of observation
Value
Absolute change
Change from previous value
jan 1, 2005
1.536K
+1.536K
0.0%
jan 1, 2006
1.717K
+181.0
11.78%
jan 1, 2007
1.786K
+69.0
4.02%
jan 1, 2008
1.848K
+62.0
3.47%
jan 1, 2009
2.008K
+160.0
8.66%
jan 1, 2010
1.753K
-255.0
-12.7%
jan 1, 2011
1.835K
+82.0
4.68%
jan 1, 2012
1.754K
-81.0
-4.41%
jan 1, 2013
1.893K
+139.0
7.92%
jan 1, 2015
2.104K
+211.0
11.15%
Ranking of countries by current statistics by years


Comments: