29
/
en
AIzaSyAYiBZKx7MnpbEhh9jyipgxe19OcubqV5w
April 1, 2024
188208
Malaysia
MYS
true
2
1
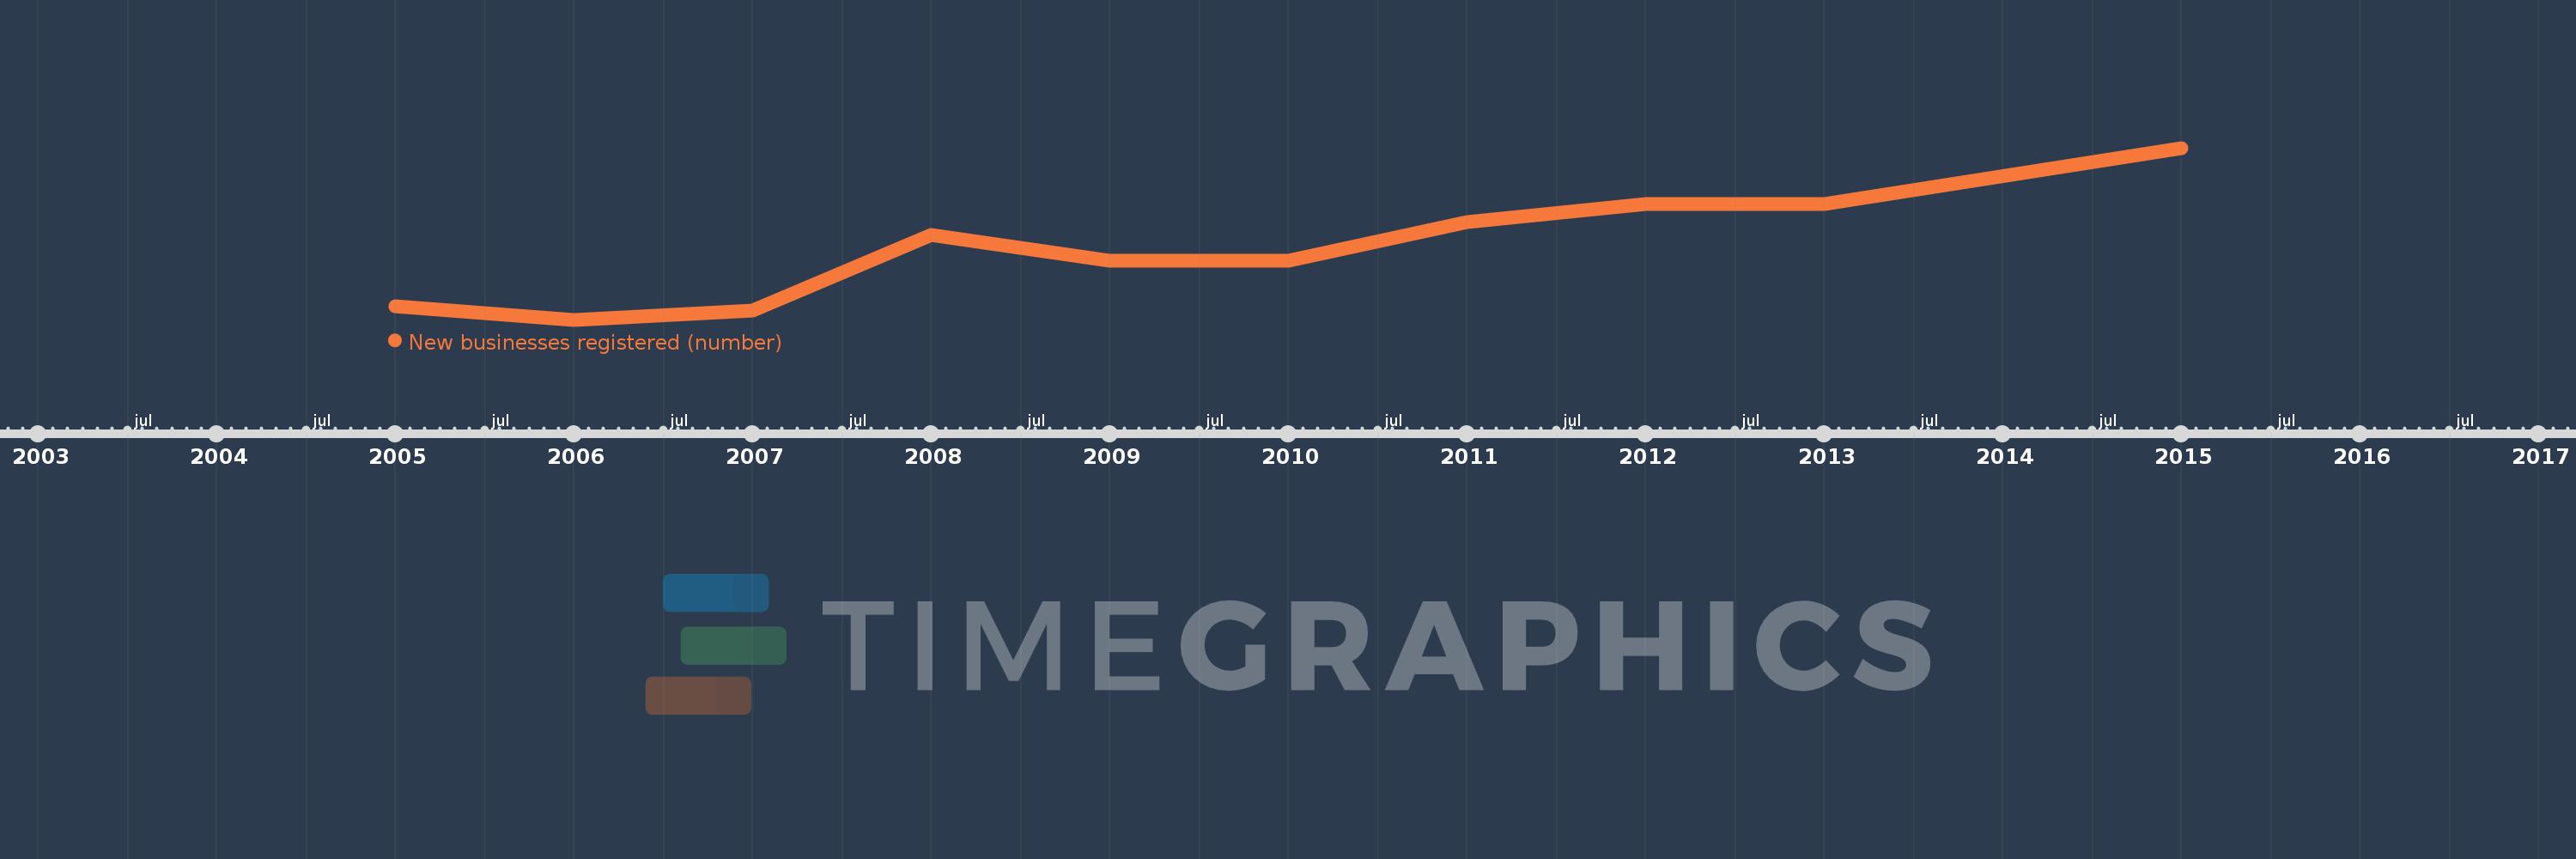
New businesses registered (number)
2015,2013,2012,2011,2010,2009,2008,2007,2006,2005
This statistics in other country:
Timeline:
This timeline shows a graph from 2005 to 2015 of Malaysia. No data until 2004. Number of actual observations by date: 10.
Source name:
World Development Indicators
Source organization:
World Bank's Entrepreneurship Survey and database (http://econ.worldbank.org/research/entrepreneurship).
Categories, topics:
Private Sector
Last updated:
apr 23, 2017
Indicators value changes by year
Minimum:
37.672K
jan 1, 2006
Maximum:
49.203K
jan 1, 2015
At the date of observation
Value
Absolute change
Change from previous value
jan 1, 2005
38.58K
+38.58K
0.0%
jan 1, 2006
37.672K
-908.0
-2.35%
jan 1, 2007
38.293K
+621.0
1.65%
jan 1, 2008
43.337K
+5.044K
13.17%
jan 1, 2009
41.623K
-1.714K
-3.96%
jan 1, 2010
41.638K
+15.0
0.04%
jan 1, 2011
44.202K
+2.564K
6.16%
jan 1, 2012
45.455K
+1.253K
2.83%
jan 1, 2013
45.441K
-14.0
-0.03%
jan 1, 2015
49.203K
+3.762K
8.28%
Ranking of countries by current statistics by years


Comments: