29
/
en
AIzaSyAYiBZKx7MnpbEhh9jyipgxe19OcubqV5w
April 1, 2024
90901
Brazil
BRA
true
2
1
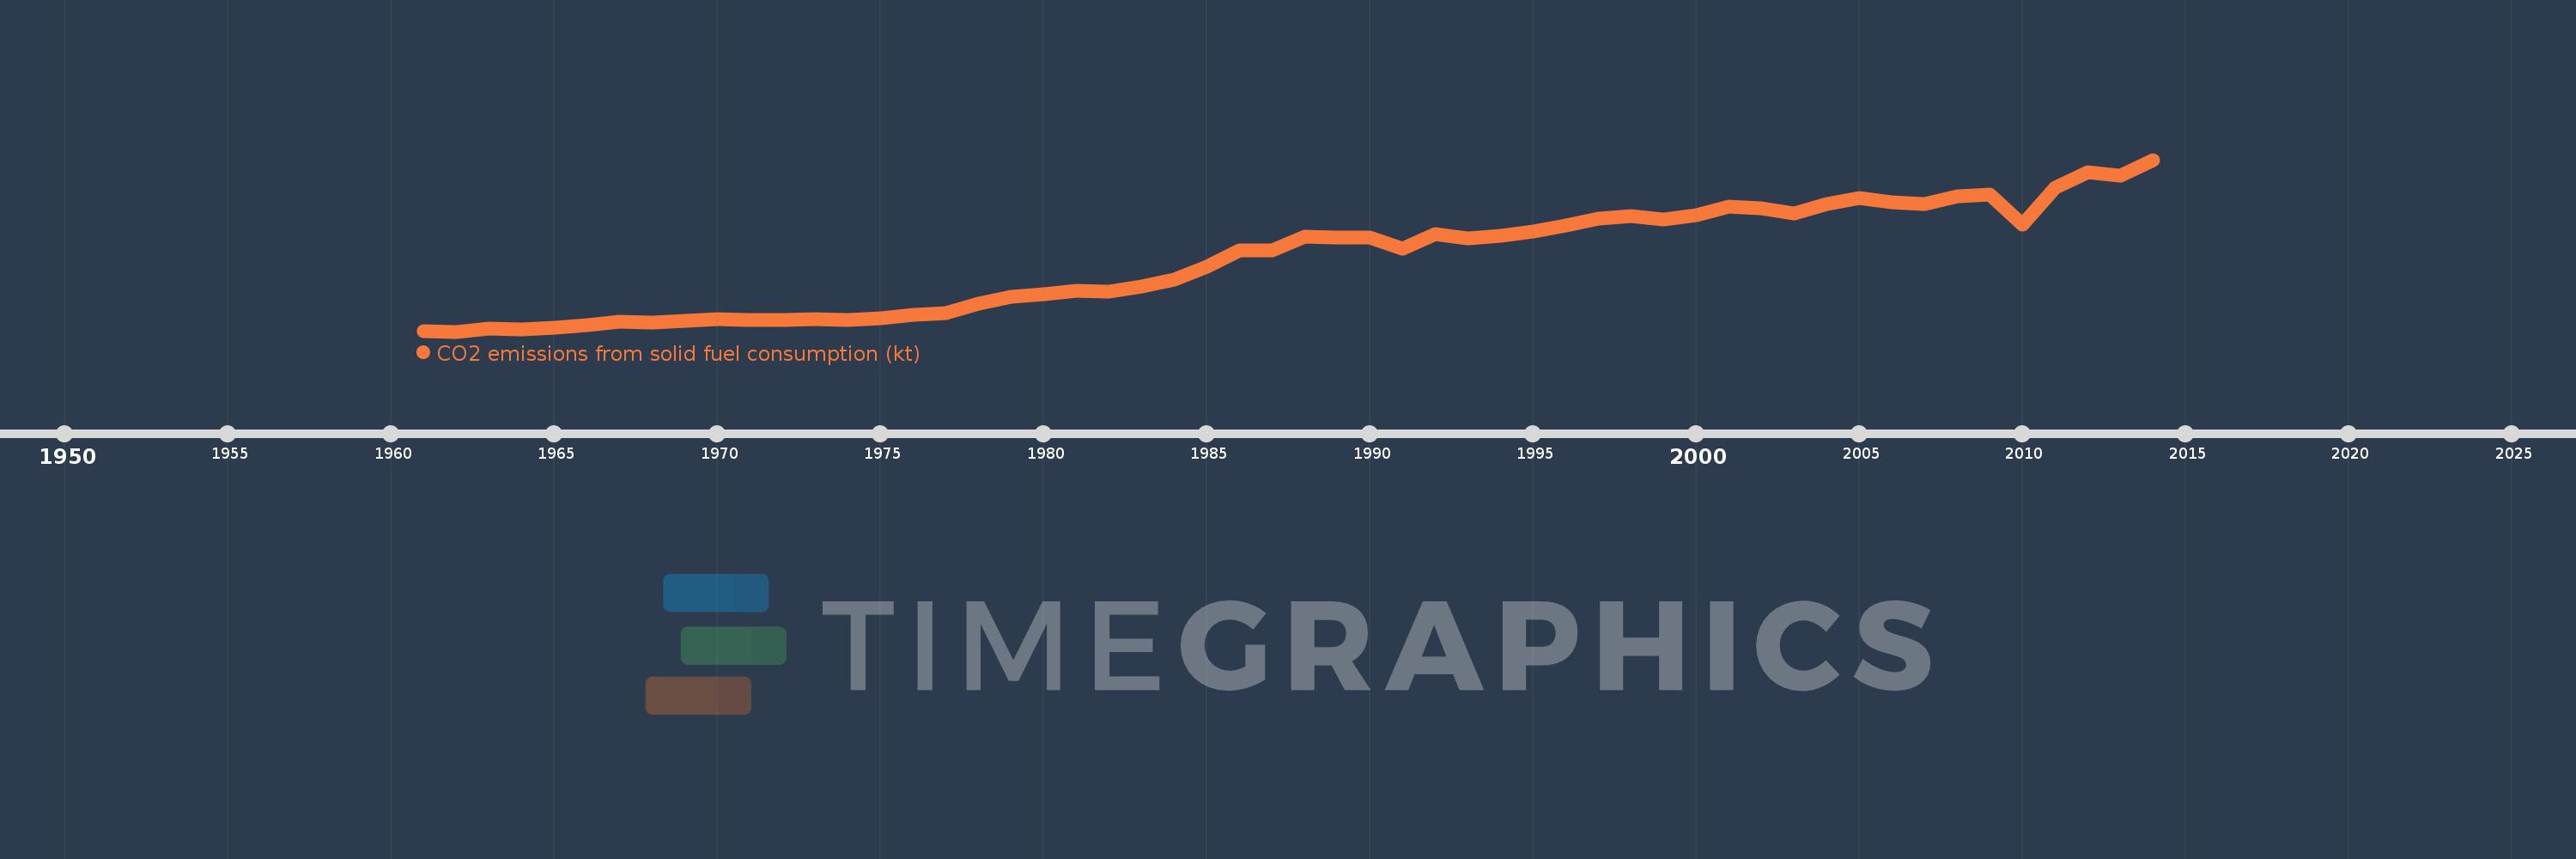
CO2 emissions from solid fuel consumption (kt)
2014,2013,2012,2011,2010,2009,2008,2007,2006,2005,2004,2003,2002,2001,2000,1999,1998,1997,1996,1995,1994,1993,1992,1991,1990,1989,1988,1987,1986,1985,1984,1983,1982,1981,1980,1979,1978,1977,1976,1975,1974,1973,1972,1971,1970,1969,1968,1967,1966,1965,1964,1963,1962,1961
This statistics in other country:
AfghanistanAlbaniaAlgeriaAndorraAngolaAntigua and BarbudaArgentinaArmeniaArubaAustraliaAustriaAzerbaijanBahamas, TheBahrainBangladeshBarbadosBelarusBelgiumBelizeBeninBermudaBhutanBoliviaBosnia and HerzegovinaBotswanaBrazilBritish Virgin IslandsBrunei DarussalamBulgariaBurkina FasoBurundiCabo VerdeCambodiaCameroonCanadaCayman IslandsCentral African RepublicCentral Europe and the BalticsChadChileChinaColombiaComorosCongo, Dem. Rep.Congo, Rep.Costa RicaCote d'IvoireCroatiaCubaCuracaoCyprusCzech RepublicDenmarkDjiboutiDominicaDominican RepublicEarly-demographic dividendEast Asia & PacificEast Asia & Pacific (excluding high income)East Asia & Pacific (IDA & IBRD countries)EcuadorEgypt, Arab Rep.El SalvadorEquatorial GuineaEritreaEstoniaEthiopiaEuro areaEurope & Central AsiaEurope & Central Asia (excluding high income)Europe & Central Asia (IDA & IBRD countries)European UnionFaroe IslandsFijiFinlandFranceFrench PolynesiaGabonGambia, TheGeorgiaGermanyGhanaGibraltarGreeceGreenlandGrenadaGuatemalaGuineaGuinea-BissauGuyanaHaitiHigh incomeHondurasHong Kong SAR, ChinaHungaryIBRD onlyIcelandIDA & IBRD totalIDA blendIDA totalIndiaIndonesiaIran, Islamic Rep.IraqIrelandIsraelItalyJamaicaJapanJordanKazakhstanKenyaKiribatiKorea, Dem. People’s Rep.Korea, Rep.KuwaitKyrgyz RepublicLao PDRLate-demographic dividendLatin America & Caribbean Latin America & Caribbean (excluding high income)Latin America & the Caribbean (IDA & IBRD countries)LatviaLebanonLesothoLiberiaLibyaLiechtensteinLithuaniaLow & middle incomeLower middle incomeLuxembourgMacao SAR, ChinaMacedonia, FYRMadagascarMalawiMalaysiaMaldivesMaliMaltaMarshall IslandsMauritaniaMauritiusMexicoMicronesia, Fed. Sts.Middle East & North Africa (excluding high income)Middle East & North Africa (IDA & IBRD countries)Middle incomeMoldovaMongoliaMontenegroMoroccoMozambiqueMyanmarNamibiaNauruNepalNetherlandsNew CaledoniaNew ZealandNicaraguaNigerNigeriaNorth AmericaNorwayOECD membersOmanPakistanPalauPanamaPapua New GuineaParaguayPeruPhilippinesPolandPortugalPost-demographic dividendQatarRomaniaRussian FederationRwandaSamoaSao Tome and PrincipeSaudi ArabiaSenegalSerbiaSeychellesSierra LeoneSingaporeSint Maarten (Dutch part)Slovak RepublicSloveniaSolomon IslandsSomaliaSouth AfricaSouth AsiaSouth Asia (IDA & IBRD)South SudanSpainSri LankaSt. Kitts and NevisSt. LuciaSt. Vincent and the GrenadinesSudanSurinameSwazilandSwedenSwitzerlandSyrian Arab RepublicTajikistanTanzaniaThailandTimor-LesteTogoTongaTrinidad and TobagoTunisiaTurkeyTurkmenistanTurks and Caicos IslandsUgandaUkraineUnited Arab EmiratesUnited KingdomUnited StatesUpper middle incomeUruguayUzbekistanVanuatuVenezuela, RBVietnamWest Bank and GazaWorldYemen, Rep.ZambiaZimbabwe Timeline:
This timeline shows a graph from 1961 to 2014 of Brazil. No data until 1960. Number of actual observations by date: 54.
Source name:
World Development Indicators
Source organization:
Carbon Dioxide Information Analysis Center, Environmental Sciences Division, Oak Ridge National Laboratory, Tennessee, United States.
Categories, topics:
Climate Change, Environment
Last updated:
apr 23, 2017
Indicators value changes by year
Minimum:
4.683K
jan 1, 1962
Maximum:
68.841K
jan 1, 2014
At the date of observation
Value
Absolute change
Change from previous value
jan 1, 1961
4.969K
+4.969K
0.0%
jan 1, 1962
4.683K
-286.026
-5.76%
jan 1, 1963
5.673K
+990.09
21.14%
jan 1, 1964
5.423K
-249.356
-4.4%
jan 1, 1965
6.175K
+751.735
13.86%
jan 1, 1966
6.949K
+773.737
12.53%
jan 1, 1967
8.372K
+1.423K
20.47%
jan 1, 1968
8.13K
-242.022
-2.89%
jan 1, 1969
8.54K
+410.704
5.05%
jan 1, 1970
9.424K
+883.747
10.35%
jan 1, 1971
8.911K
-513.38
-5.45%
jan 1, 1972
8.991K
+80.674
0.91%
jan 1, 1973
9.38K
+388.702
4.32%
jan 1, 1974
9.017K
-363.033
-3.87%
jan 1, 1975
9.549K
+531.715
5.9%
jan 1, 1976
11.071K
+1.522K
15.94%
jan 1, 1977
11.529K
+458.375
4.14%
jan 1, 1978
15.068K
+3.539K
30.69%
jan 1, 1979
17.723K
+2.655K
17.62%
jan 1, 1980
18.478K
+755.402
4.26%
jan 1, 1981
20.003K
+1.525K
8.26%
jan 1, 1982
19.739K
-264.024
-1.32%
jan 1, 1983
21.569K
+1.83K
9.27%
jan 1, 1984
23.946K
+2.376K
11.02%
jan 1, 1985
29.021K
+5.075K
21.19%
jan 1, 1986
34.899K
+5.878K
20.26%
jan 1, 1987
35.152K
+253.023
0.73%
jan 1, 1988
40.267K
+5.115K
14.55%
jan 1, 1989
39.809K
-458.375
-1.14%
jan 1, 1990
39.963K
+154.014
0.39%
jan 1, 1991
35.75K
-4.213K
-10.54%
jan 1, 1992
41.037K
+5.288K
14.79%
jan 1, 1993
39.442K
-1.595K
-3.89%
jan 1, 1994
40.443K
+1.001K
2.54%
jan 1, 1995
42.115K
+1.672K
4.13%
jan 1, 1996
44.404K
+2.288K
5.43%
jan 1, 1997
46.894K
+2.49K
5.61%
jan 1, 1998
47.678K
+784.738
1.67%
jan 1, 1999
46.608K
-1.071K
-2.25%
jan 1, 2000
48.217K
+1.61K
3.45%
jan 1, 2001
51.25K
+3.033K
6.29%
jan 1, 2002
50.645K
-605.055
-1.18%
jan 1, 2003
48.826K
-1.819K
-3.59%
jan 1, 2004
52.379K
+3.553K
7.28%
jan 1, 2005
54.481K
+2.101K
4.01%
jan 1, 2006
52.816K
-1.665K
-3.06%
jan 1, 2007
52.269K
-546.383
-1.03%
jan 1, 2008
55.346K
+3.077K
5.89%
jan 1, 2009
56.006K
+660.06
1.19%
jan 1, 2010
44.495K
-11.511K
-20.55%
jan 1, 2011
58.544K
+14.048K
31.57%
jan 1, 2012
64.165K
+5.622K
9.6%
jan 1, 2013
62.944K
-1.221K
-1.9%
jan 1, 2014
68.841K
+5.897K
9.37%
Ranking of countries by current statistics by years


Comments: