29
/
en
AIzaSyAYiBZKx7MnpbEhh9jyipgxe19OcubqV5w
April 1, 2024
121883
Dominican Republic
DOM
true
2
1
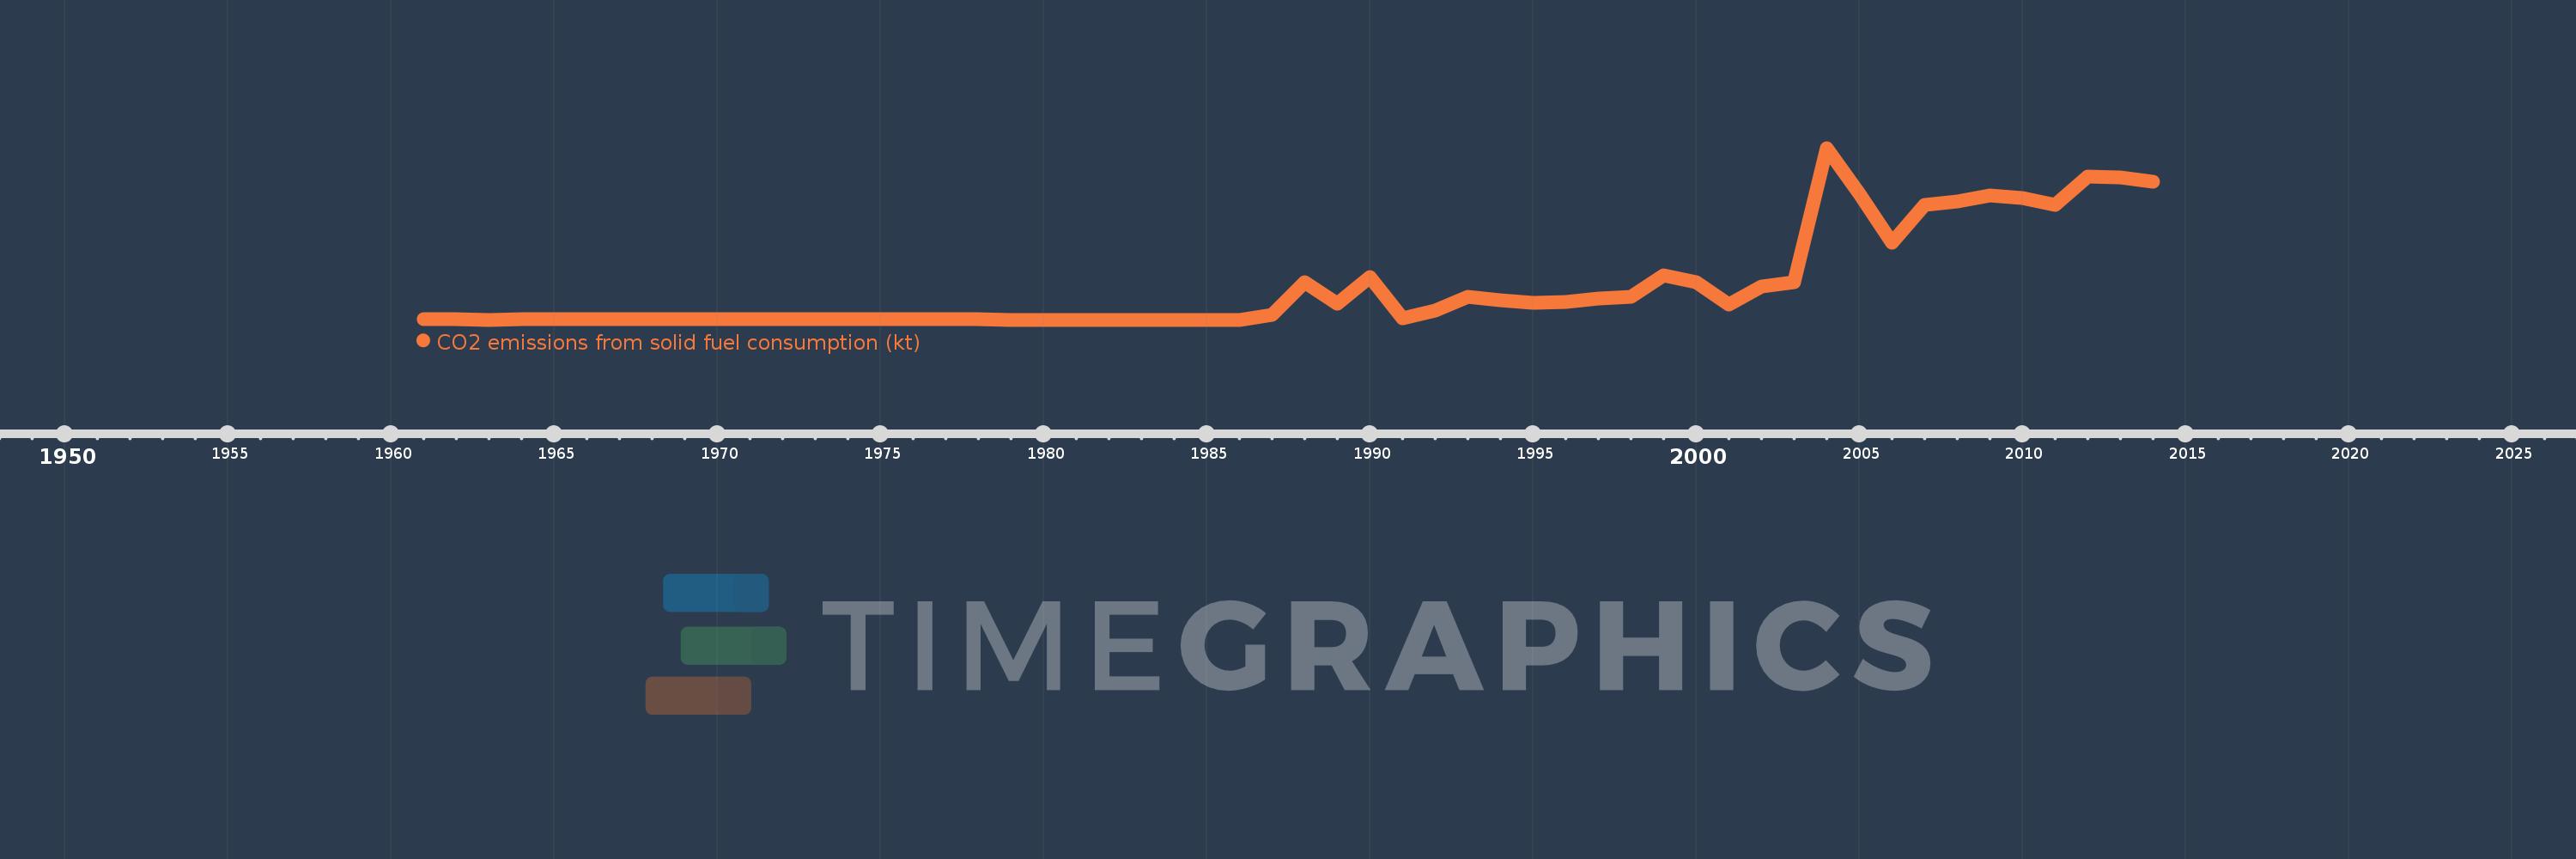
CO2 emissions from solid fuel consumption (kt)
2014,2013,2012,2011,2010,2009,2008,2007,2006,2005,2004,2003,2002,2001,2000,1999,1998,1997,1996,1995,1994,1993,1992,1991,1990,1989,1988,1987,1986,1985,1984,1983,1982,1981,1980,1979,1978,1977,1976,1975,1974,1973,1972,1971,1970,1969,1968,1967,1966,1965,1964,1963,1962,1961
This statistics in other country:
AfghanistanAlbaniaAlgeriaAndorraAngolaAntigua and BarbudaArgentinaArmeniaArubaAustraliaAustriaAzerbaijanBahamas, TheBahrainBangladeshBarbadosBelarusBelgiumBelizeBeninBermudaBhutanBoliviaBosnia and HerzegovinaBotswanaBrazilBritish Virgin IslandsBrunei DarussalamBulgariaBurkina FasoBurundiCabo VerdeCambodiaCameroonCanadaCayman IslandsCentral African RepublicCentral Europe and the BalticsChadChileChinaColombiaComorosCongo, Dem. Rep.Congo, Rep.Costa RicaCote d'IvoireCroatiaCubaCuracaoCyprusCzech RepublicDenmarkDjiboutiDominicaDominican RepublicEarly-demographic dividendEast Asia & PacificEast Asia & Pacific (excluding high income)East Asia & Pacific (IDA & IBRD countries)EcuadorEgypt, Arab Rep.El SalvadorEquatorial GuineaEritreaEstoniaEthiopiaEuro areaEurope & Central AsiaEurope & Central Asia (excluding high income)Europe & Central Asia (IDA & IBRD countries)European UnionFaroe IslandsFijiFinlandFranceFrench PolynesiaGabonGambia, TheGeorgiaGermanyGhanaGibraltarGreeceGreenlandGrenadaGuatemalaGuineaGuinea-BissauGuyanaHaitiHigh incomeHondurasHong Kong SAR, ChinaHungaryIBRD onlyIcelandIDA & IBRD totalIDA blendIDA totalIndiaIndonesiaIran, Islamic Rep.IraqIrelandIsraelItalyJamaicaJapanJordanKazakhstanKenyaKiribatiKorea, Dem. People’s Rep.Korea, Rep.KuwaitKyrgyz RepublicLao PDRLate-demographic dividendLatin America & Caribbean Latin America & Caribbean (excluding high income)Latin America & the Caribbean (IDA & IBRD countries)LatviaLebanonLesothoLiberiaLibyaLiechtensteinLithuaniaLow & middle incomeLower middle incomeLuxembourgMacao SAR, ChinaMacedonia, FYRMadagascarMalawiMalaysiaMaldivesMaliMaltaMarshall IslandsMauritaniaMauritiusMexicoMicronesia, Fed. Sts.Middle East & North Africa (excluding high income)Middle East & North Africa (IDA & IBRD countries)Middle incomeMoldovaMongoliaMontenegroMoroccoMozambiqueMyanmarNamibiaNauruNepalNetherlandsNew CaledoniaNew ZealandNicaraguaNigerNigeriaNorth AmericaNorwayOECD membersOmanPakistanPalauPanamaPapua New GuineaParaguayPeruPhilippinesPolandPortugalPost-demographic dividendQatarRomaniaRussian FederationRwandaSamoaSao Tome and PrincipeSaudi ArabiaSenegalSerbiaSeychellesSierra LeoneSingaporeSint Maarten (Dutch part)Slovak RepublicSloveniaSolomon IslandsSomaliaSouth AfricaSouth AsiaSouth Asia (IDA & IBRD)South SudanSpainSri LankaSt. Kitts and NevisSt. LuciaSt. Vincent and the GrenadinesSudanSurinameSwazilandSwedenSwitzerlandSyrian Arab RepublicTajikistanTanzaniaThailandTimor-LesteTogoTongaTrinidad and TobagoTunisiaTurkeyTurkmenistanTurks and Caicos IslandsUgandaUkraineUnited Arab EmiratesUnited KingdomUnited StatesUpper middle incomeUruguayUzbekistanVanuatuVenezuela, RBVietnamWest Bank and GazaWorldYemen, Rep.ZambiaZimbabwe Timeline:
This timeline shows a graph from 1961 to 2014 of Dominican Republic. No data until 1960. Number of actual observations by date: 54.
Source name:
World Development Indicators
Source organization:
Carbon Dioxide Information Analysis Center, Environmental Sciences Division, Oak Ridge National Laboratory, Tennessee, United States.
Categories, topics:
Climate Change, Environment
Last updated:
apr 23, 2017
Indicators value changes by year
Maximum:
2.805K
jan 1, 2004
At the date of observation
Value
Absolute change
Change from previous value
jan 1, 1961
3.667
+3.667
0.0%
jan 1, 1962
3.667
0.0
0.0%
jan 1, 1963
0.0
-3.667
-100.0%
jan 1, 1964
3.667
+3.667
%
jan 1, 1965
3.667
0.0
0.0%
jan 1, 1966
3.667
0.0
0.0%
jan 1, 1967
3.667
0.0
0.0%
jan 1, 1968
3.667
0.0
0.0%
jan 1, 1969
3.667
0.0
0.0%
jan 1, 1970
3.667
0.0
0.0%
jan 1, 1971
3.667
0.0
0.0%
jan 1, 1972
3.667
0.0
0.0%
jan 1, 1973
3.667
0.0
0.0%
jan 1, 1974
3.667
0.0
0.0%
jan 1, 1975
3.667
0.0
0.0%
jan 1, 1976
3.667
0.0
0.0%
jan 1, 1977
3.667
0.0
0.0%
jan 1, 1978
3.667
0.0
0.0%
jan 1, 1979
0.0
-3.667
-100.0%
jan 1, 1987
73.34
+73.34
%
jan 1, 1988
616.056
+542.716
740.0%
jan 1, 1989
256.69
-359.366
-58.33%
jan 1, 1990
696.73
+440.04
171.43%
jan 1, 1991
25.669
-671.061
-96.32%
jan 1, 1992
150.347
+124.678
485.71%
jan 1, 1993
370.367
+220.02
146.34%
jan 1, 1994
319.029
-51.338
-13.86%
jan 1, 1995
275.025
-44.004
-13.79%
jan 1, 1996
293.36
+18.335
6.67%
jan 1, 1997
341.031
+47.671
16.25%
jan 1, 1998
370.367
+29.336
8.6%
jan 1, 1999
718.732
+348.365
94.06%
jan 1, 2000
619.723
-99.009
-13.78%
jan 1, 2001
245.689
-374.034
-60.36%
jan 1, 2002
539.049
+293.36
119.4%
jan 1, 2003
619.723
+80.674
14.97%
jan 1, 2004
2.805K
+2.186K
352.66%
jan 1, 2005
2.065K
-740.734
-26.41%
jan 1, 2006
1.265K
-799.406
-38.72%
jan 1, 2007
1.87K
+605.055
47.83%
jan 1, 2008
1.933K
+62.339
3.33%
jan 1, 2009
2.024K
+91.675
4.74%
jan 1, 2010
1.984K
-40.337
-1.99%
jan 1, 2011
1.881K
-102.676
-5.18%
jan 1, 2012
2.343K
+462.042
24.56%
jan 1, 2013
2.321K
-22.002
-0.94%
jan 1, 2014
2.255K
-66.006
-2.84%
Ranking of countries by current statistics by years


Comments: