29
/
en
AIzaSyAYiBZKx7MnpbEhh9jyipgxe19OcubqV5w
April 1, 2024
208638
New Caledonia
NCL
true
2
1
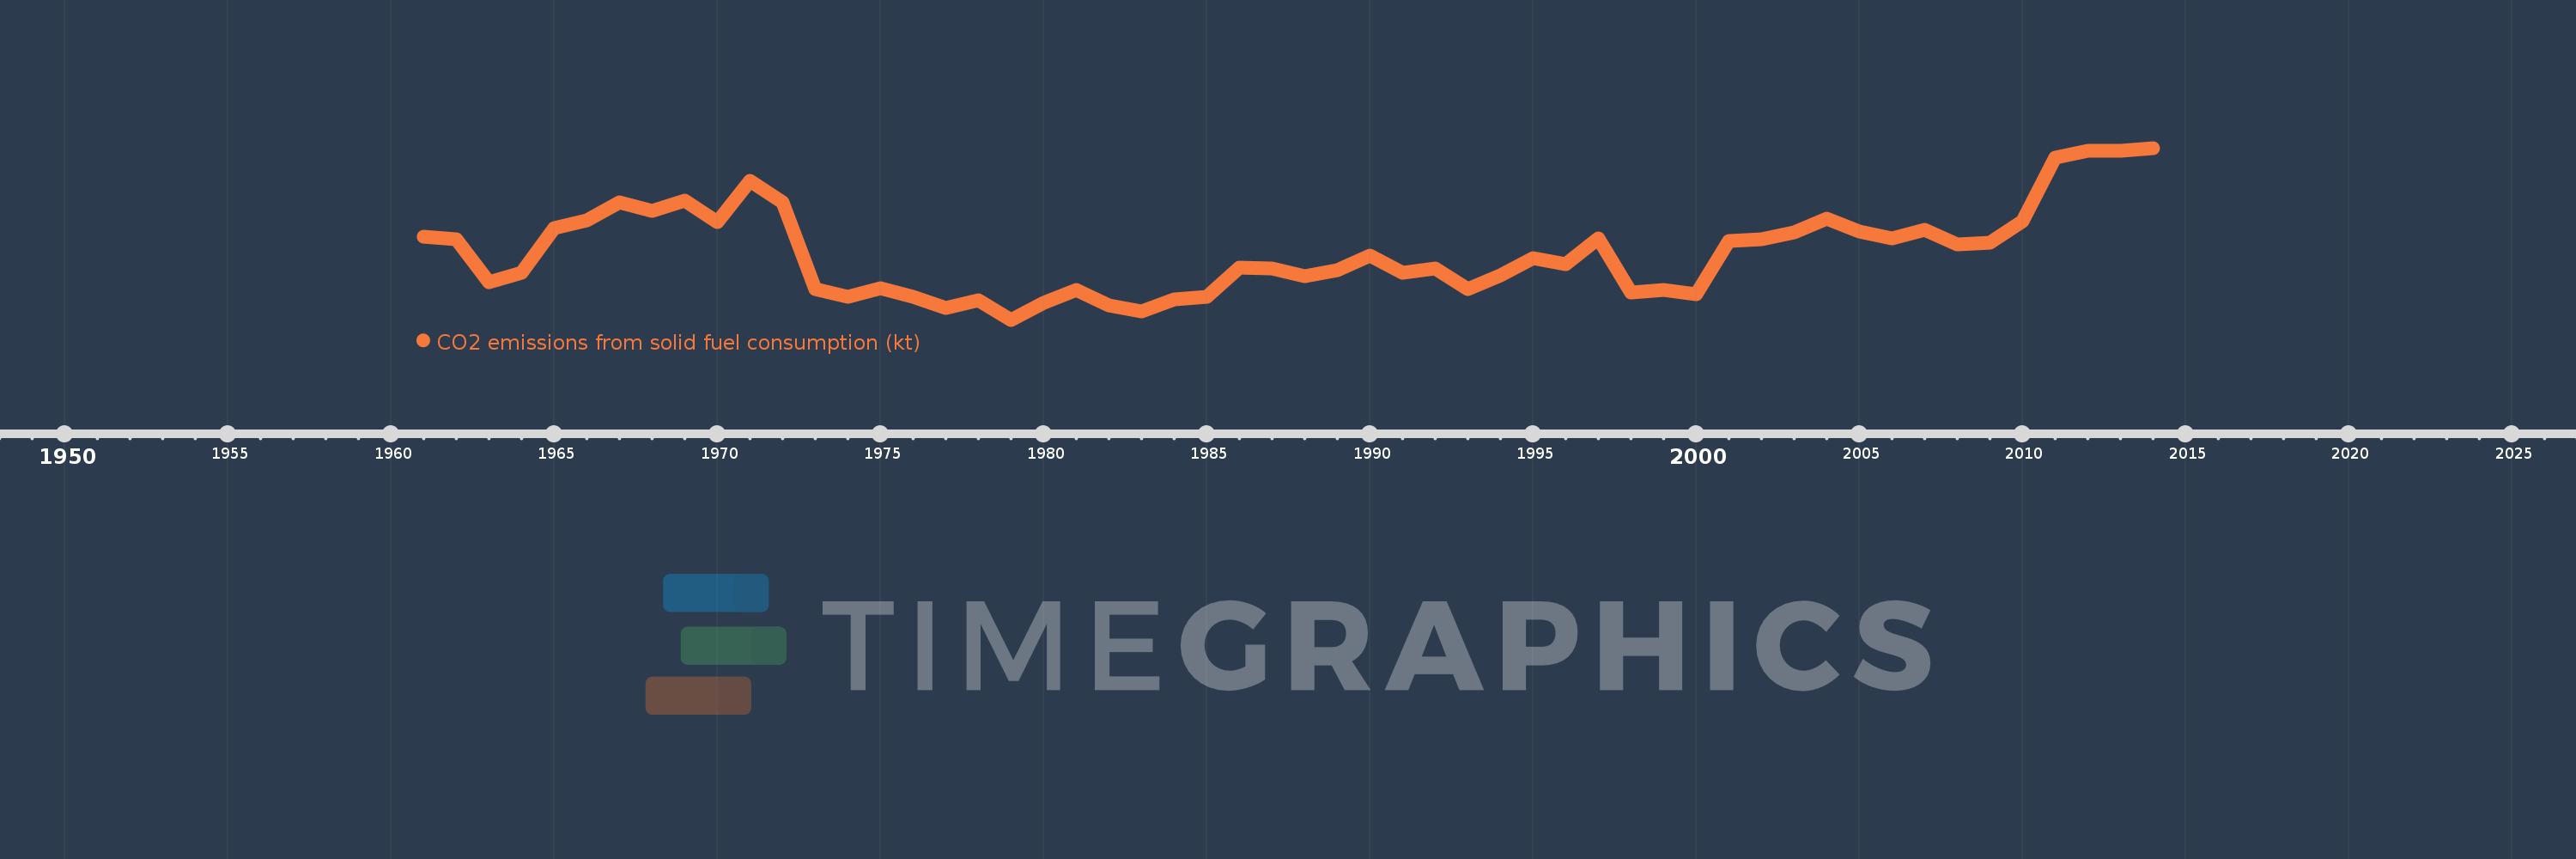
CO2 emissions from solid fuel consumption (kt)
2014,2013,2012,2011,2010,2009,2008,2007,2006,2005,2004,2003,2002,2001,2000,1999,1998,1997,1996,1995,1994,1993,1992,1991,1990,1989,1988,1987,1986,1985,1984,1983,1982,1981,1980,1979,1978,1977,1976,1975,1974,1973,1972,1971,1970,1969,1968,1967,1966,1965,1964,1963,1962,1961
This statistics in other country:
AfghanistanAlbaniaAlgeriaAndorraAngolaAntigua and BarbudaArgentinaArmeniaArubaAustraliaAustriaAzerbaijanBahamas, TheBahrainBangladeshBarbadosBelarusBelgiumBelizeBeninBermudaBhutanBoliviaBosnia and HerzegovinaBotswanaBrazilBritish Virgin IslandsBrunei DarussalamBulgariaBurkina FasoBurundiCabo VerdeCambodiaCameroonCanadaCayman IslandsCentral African RepublicCentral Europe and the BalticsChadChileChinaColombiaComorosCongo, Dem. Rep.Congo, Rep.Costa RicaCote d'IvoireCroatiaCubaCuracaoCyprusCzech RepublicDenmarkDjiboutiDominicaDominican RepublicEarly-demographic dividendEast Asia & PacificEast Asia & Pacific (excluding high income)East Asia & Pacific (IDA & IBRD countries)EcuadorEgypt, Arab Rep.El SalvadorEquatorial GuineaEritreaEstoniaEthiopiaEuro areaEurope & Central AsiaEurope & Central Asia (excluding high income)Europe & Central Asia (IDA & IBRD countries)European UnionFaroe IslandsFijiFinlandFranceFrench PolynesiaGabonGambia, TheGeorgiaGermanyGhanaGibraltarGreeceGreenlandGrenadaGuatemalaGuineaGuinea-BissauGuyanaHaitiHigh incomeHondurasHong Kong SAR, ChinaHungaryIBRD onlyIcelandIDA & IBRD totalIDA blendIDA totalIndiaIndonesiaIran, Islamic Rep.IraqIrelandIsraelItalyJamaicaJapanJordanKazakhstanKenyaKiribatiKorea, Dem. People’s Rep.Korea, Rep.KuwaitKyrgyz RepublicLao PDRLate-demographic dividendLatin America & Caribbean Latin America & Caribbean (excluding high income)Latin America & the Caribbean (IDA & IBRD countries)LatviaLebanonLesothoLiberiaLibyaLiechtensteinLithuaniaLow & middle incomeLower middle incomeLuxembourgMacao SAR, ChinaMacedonia, FYRMadagascarMalawiMalaysiaMaldivesMaliMaltaMarshall IslandsMauritaniaMauritiusMexicoMicronesia, Fed. Sts.Middle East & North Africa (excluding high income)Middle East & North Africa (IDA & IBRD countries)Middle incomeMoldovaMongoliaMontenegroMoroccoMozambiqueMyanmarNamibiaNauruNepalNetherlandsNew CaledoniaNew ZealandNicaraguaNigerNigeriaNorth AmericaNorwayOECD membersOmanPakistanPalauPanamaPapua New GuineaParaguayPeruPhilippinesPolandPortugalPost-demographic dividendQatarRomaniaRussian FederationRwandaSamoaSao Tome and PrincipeSaudi ArabiaSenegalSerbiaSeychellesSierra LeoneSingaporeSint Maarten (Dutch part)Slovak RepublicSloveniaSolomon IslandsSomaliaSouth AfricaSouth AsiaSouth Asia (IDA & IBRD)South SudanSpainSri LankaSt. Kitts and NevisSt. LuciaSt. Vincent and the GrenadinesSudanSurinameSwazilandSwedenSwitzerlandSyrian Arab RepublicTajikistanTanzaniaThailandTimor-LesteTogoTongaTrinidad and TobagoTunisiaTurkeyTurkmenistanTurks and Caicos IslandsUgandaUkraineUnited Arab EmiratesUnited KingdomUnited StatesUpper middle incomeUruguayUzbekistanVanuatuVenezuela, RBVietnamWest Bank and GazaWorldYemen, Rep.ZambiaZimbabwe Timeline:
This timeline shows a graph from 1961 to 2014 of New Caledonia. No data until 1960. Number of actual observations by date: 54.
Source name:
World Development Indicators
Source organization:
Carbon Dioxide Information Analysis Center, Environmental Sciences Division, Oak Ridge National Laboratory, Tennessee, United States.
Categories, topics:
Climate Change, Environment
Last updated:
apr 23, 2017
Indicators value changes by year
Minimum:
117.344
jan 1, 1979
Maximum:
1.283K
jan 1, 2014
At the date of observation
Value
Absolute change
Change from previous value
jan 1, 1961
682.062
+682.062
0.0%
jan 1, 1962
663.727
-18.335
-2.69%
jan 1, 1963
374.034
-289.693
-43.65%
jan 1, 1964
436.373
+62.339
16.67%
jan 1, 1965
740.734
+304.361
69.75%
jan 1, 1966
792.072
+51.338
6.93%
jan 1, 1967
916.75
+124.678
15.74%
jan 1, 1968
858.078
-58.672
-6.4%
jan 1, 1969
924.084
+66.006
7.69%
jan 1, 1970
777.404
-146.68
-15.87%
jan 1, 1971
1.06K
+282.359
36.32%
jan 1, 1972
916.75
-143.013
-13.49%
jan 1, 1973
322.696
-594.054
-64.8%
jan 1, 1974
275.025
-47.671
-14.77%
jan 1, 1975
333.697
+58.672
21.33%
jan 1, 1976
271.358
-62.339
-18.68%
jan 1, 1977
198.018
-73.34
-27.03%
jan 1, 1978
249.356
+51.338
25.93%
jan 1, 1979
117.344
-132.012
-52.94%
jan 1, 1980
234.688
+117.344
100.0%
jan 1, 1981
319.029
+84.341
35.94%
jan 1, 1982
216.353
-102.676
-32.18%
jan 1, 1983
172.349
-44.004
-20.34%
jan 1, 1984
256.69
+84.341
48.94%
jan 1, 1985
275.025
+18.335
7.14%
jan 1, 1986
469.376
+194.351
70.67%
jan 1, 1987
465.709
-3.667
-0.78%
jan 1, 1988
410.704
-55.005
-11.81%
jan 1, 1989
451.041
+40.337
9.82%
jan 1, 1990
550.05
+99.009
21.95%
jan 1, 1991
436.373
-113.677
-20.67%
jan 1, 1992
465.709
+29.336
6.72%
jan 1, 1993
322.696
-143.013
-30.71%
jan 1, 1994
418.038
+95.342
29.55%
jan 1, 1995
535.382
+117.344
28.07%
jan 1, 1996
495.045
-40.337
-7.53%
jan 1, 1997
667.394
+172.349
34.81%
jan 1, 1998
300.694
-366.7
-54.95%
jan 1, 1999
319.029
+18.335
6.1%
jan 1, 2000
293.36
-25.669
-8.05%
jan 1, 2001
652.726
+359.366
122.5%
jan 1, 2002
663.727
+11.001
1.69%
jan 1, 2003
707.731
+44.004
6.63%
jan 1, 2004
803.073
+95.342
13.47%
jan 1, 2005
718.732
-84.341
-10.5%
jan 1, 2006
667.394
-51.338
-7.14%
jan 1, 2007
726.066
+58.672
8.79%
jan 1, 2008
627.057
-99.009
-13.64%
jan 1, 2009
641.725
+14.668
2.34%
jan 1, 2010
788.405
+146.68
22.86%
jan 1, 2011
1.217K
+429.039
54.42%
jan 1, 2012
1.265K
+47.671
3.92%
jan 1, 2013
1.265K
0.0
0.0%
jan 1, 2014
1.283K
+18.335
1.45%
Ranking of countries by current statistics by years


Comments: