29
/
en
AIzaSyAYiBZKx7MnpbEhh9jyipgxe19OcubqV5w
April 1, 2024
157054
Iran, Islamic Rep.
IRN
true
2
1
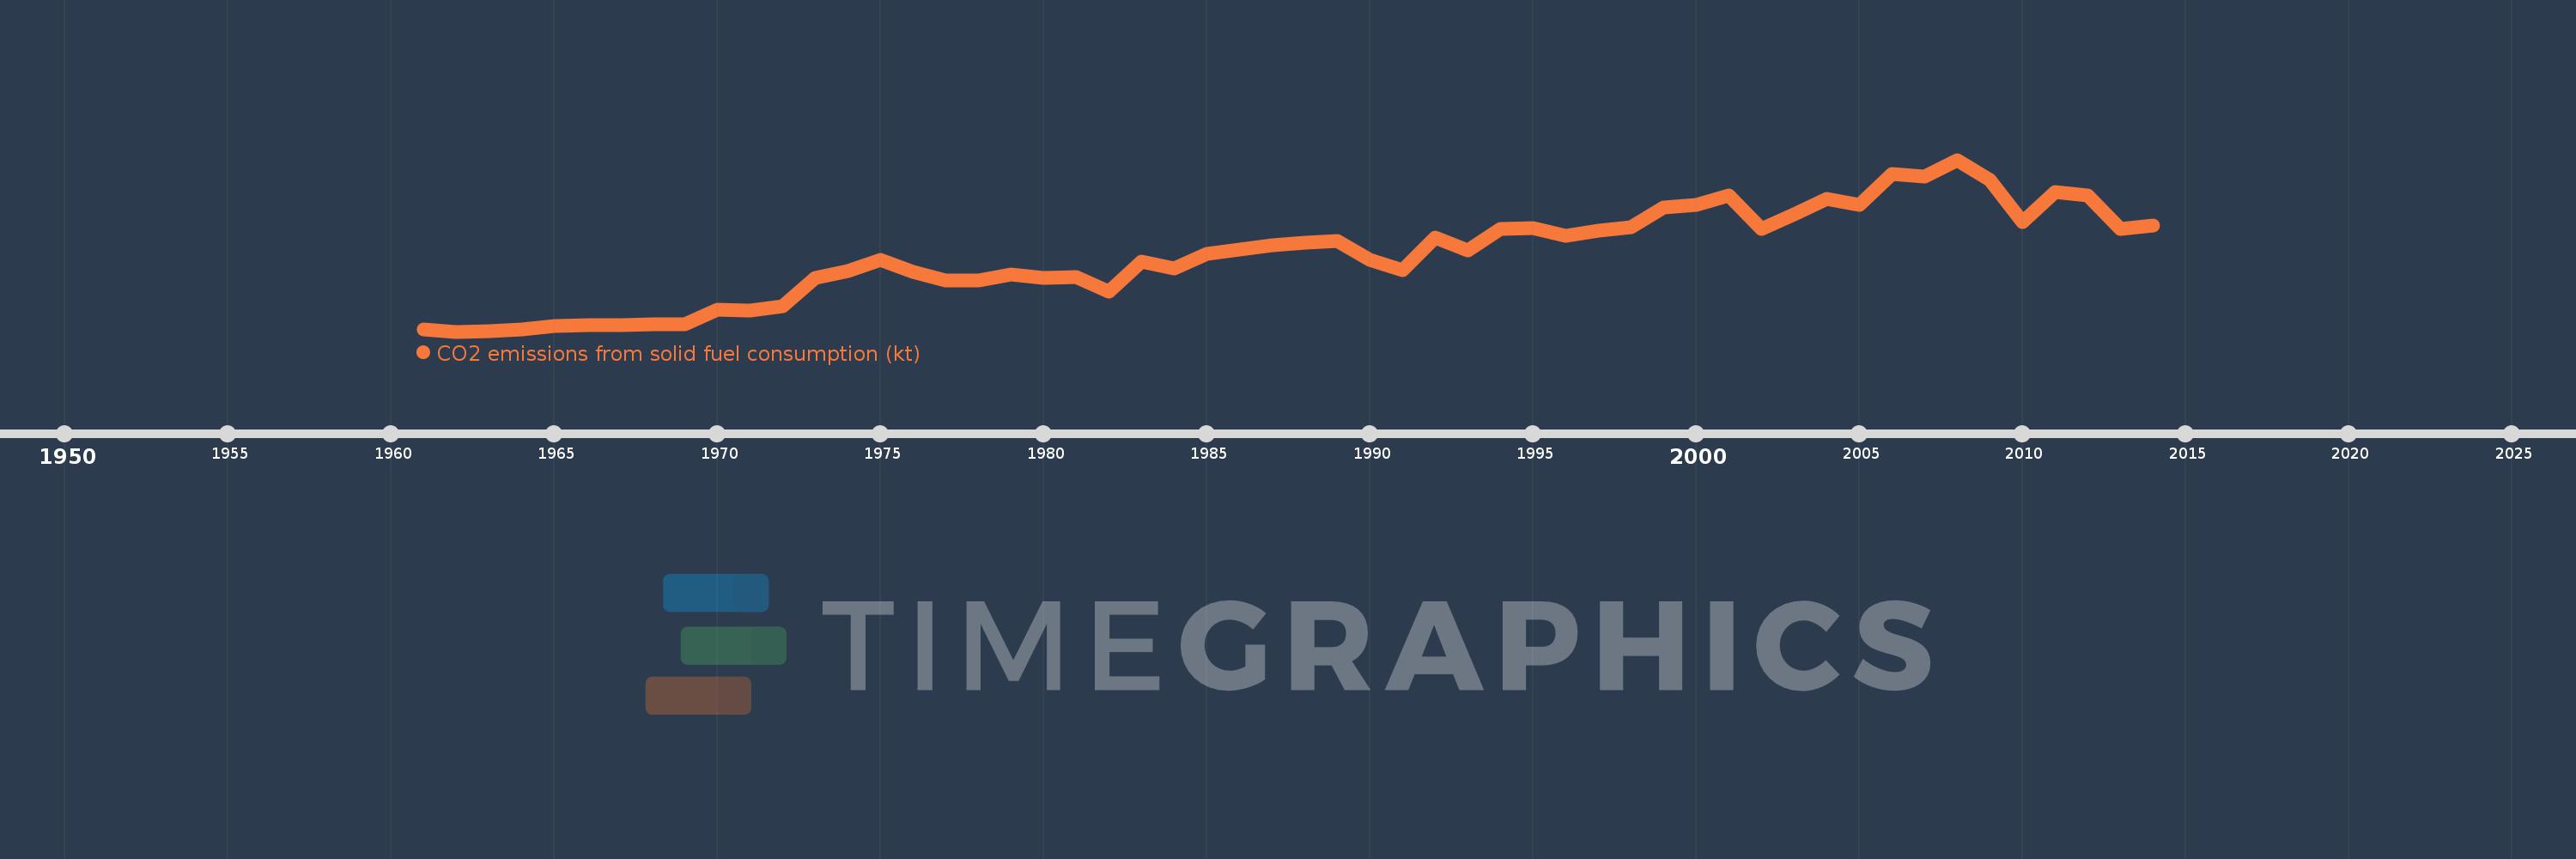
CO2 emissions from solid fuel consumption (kt)
2014,2013,2012,2011,2010,2009,2008,2007,2006,2005,2004,2003,2002,2001,2000,1999,1998,1997,1996,1995,1994,1993,1992,1991,1990,1989,1988,1987,1986,1985,1984,1983,1982,1981,1980,1979,1978,1977,1976,1975,1974,1973,1972,1971,1970,1969,1968,1967,1966,1965,1964,1963,1962,1961
This statistics in other country:
AfghanistanAlbaniaAlgeriaAndorraAngolaAntigua and BarbudaArgentinaArmeniaArubaAustraliaAustriaAzerbaijanBahamas, TheBahrainBangladeshBarbadosBelarusBelgiumBelizeBeninBermudaBhutanBoliviaBosnia and HerzegovinaBotswanaBrazilBritish Virgin IslandsBrunei DarussalamBulgariaBurkina FasoBurundiCabo VerdeCambodiaCameroonCanadaCayman IslandsCentral African RepublicCentral Europe and the BalticsChadChileChinaColombiaComorosCongo, Dem. Rep.Congo, Rep.Costa RicaCote d'IvoireCroatiaCubaCuracaoCyprusCzech RepublicDenmarkDjiboutiDominicaDominican RepublicEarly-demographic dividendEast Asia & PacificEast Asia & Pacific (excluding high income)East Asia & Pacific (IDA & IBRD countries)EcuadorEgypt, Arab Rep.El SalvadorEquatorial GuineaEritreaEstoniaEthiopiaEuro areaEurope & Central AsiaEurope & Central Asia (excluding high income)Europe & Central Asia (IDA & IBRD countries)European UnionFaroe IslandsFijiFinlandFranceFrench PolynesiaGabonGambia, TheGeorgiaGermanyGhanaGibraltarGreeceGreenlandGrenadaGuatemalaGuineaGuinea-BissauGuyanaHaitiHigh incomeHondurasHong Kong SAR, ChinaHungaryIBRD onlyIcelandIDA & IBRD totalIDA blendIDA totalIndiaIndonesiaIran, Islamic Rep.IraqIrelandIsraelItalyJamaicaJapanJordanKazakhstanKenyaKiribatiKorea, Dem. People’s Rep.Korea, Rep.KuwaitKyrgyz RepublicLao PDRLate-demographic dividendLatin America & Caribbean Latin America & Caribbean (excluding high income)Latin America & the Caribbean (IDA & IBRD countries)LatviaLebanonLesothoLiberiaLibyaLiechtensteinLithuaniaLow & middle incomeLower middle incomeLuxembourgMacao SAR, ChinaMacedonia, FYRMadagascarMalawiMalaysiaMaldivesMaliMaltaMarshall IslandsMauritaniaMauritiusMexicoMicronesia, Fed. Sts.Middle East & North Africa (excluding high income)Middle East & North Africa (IDA & IBRD countries)Middle incomeMoldovaMongoliaMontenegroMoroccoMozambiqueMyanmarNamibiaNauruNepalNetherlandsNew CaledoniaNew ZealandNicaraguaNigerNigeriaNorth AmericaNorwayOECD membersOmanPakistanPalauPanamaPapua New GuineaParaguayPeruPhilippinesPolandPortugalPost-demographic dividendQatarRomaniaRussian FederationRwandaSamoaSao Tome and PrincipeSaudi ArabiaSenegalSerbiaSeychellesSierra LeoneSingaporeSint Maarten (Dutch part)Slovak RepublicSloveniaSolomon IslandsSomaliaSouth AfricaSouth AsiaSouth Asia (IDA & IBRD)South SudanSpainSri LankaSt. Kitts and NevisSt. LuciaSt. Vincent and the GrenadinesSudanSurinameSwazilandSwedenSwitzerlandSyrian Arab RepublicTajikistanTanzaniaThailandTimor-LesteTogoTongaTrinidad and TobagoTunisiaTurkeyTurkmenistanTurks and Caicos IslandsUgandaUkraineUnited Arab EmiratesUnited KingdomUnited StatesUpper middle incomeUruguayUzbekistanVanuatuVenezuela, RBVietnamWest Bank and GazaWorldYemen, Rep.ZambiaZimbabwe Timeline:
This timeline shows a graph from 1961 to 2014 of Iran, Islamic Rep.. No data until 1960. Number of actual observations by date: 54.
Source name:
World Development Indicators
Source organization:
Carbon Dioxide Information Analysis Center, Environmental Sciences Division, Oak Ridge National Laboratory, Tennessee, United States.
Categories, topics:
Climate Change, Environment
Last updated:
apr 23, 2017
Indicators value changes by year
Minimum:
524.381
jan 1, 1962
Maximum:
6.582K
jan 1, 2008
At the date of observation
Value
Absolute change
Change from previous value
jan 1, 1961
612.389
+612.389
0.0%
jan 1, 1962
524.381
-88.008
-14.37%
jan 1, 1963
542.716
+18.335
3.5%
jan 1, 1964
605.055
+62.339
11.49%
jan 1, 1965
726.066
+121.011
20.0%
jan 1, 1966
755.402
+29.336
4.04%
jan 1, 1967
755.402
0.0
0.0%
jan 1, 1968
770.07
+14.668
1.94%
jan 1, 1969
788.405
+18.335
2.38%
jan 1, 1970
1.302K
+513.38
65.12%
jan 1, 1971
1.261K
-40.337
-3.1%
jan 1, 1972
1.43K
+168.682
13.37%
jan 1, 1973
2.428K
+997.424
69.74%
jan 1, 1974
2.666K
+238.355
9.82%
jan 1, 1975
3.04K
+374.034
14.03%
jan 1, 1976
2.618K
-421.705
-13.87%
jan 1, 1977
2.329K
-289.693
-11.06%
jan 1, 1978
2.336K
+7.334
0.31%
jan 1, 1979
2.538K
+201.685
8.63%
jan 1, 1980
2.409K
-128.345
-5.06%
jan 1, 1981
2.435K
+25.669
1.07%
jan 1, 1982
1.929K
-506.046
-20.78%
jan 1, 1983
3.0K
+1.071K
55.51%
jan 1, 1984
2.754K
-245.689
-8.19%
jan 1, 1985
3.275K
+520.714
18.91%
jan 1, 1986
3.429K
+154.014
4.7%
jan 1, 1987
3.583K
+154.014
4.49%
jan 1, 1988
3.656K
+73.34
2.05%
jan 1, 1989
3.707K
+51.338
1.4%
jan 1, 1990
3.058K
-649.059
-17.51%
jan 1, 1991
2.695K
-363.033
-11.87%
jan 1, 1992
3.847K
+1.151K
42.72%
jan 1, 1993
3.388K
-458.375
-11.92%
jan 1, 1994
4.136K
+748.068
22.08%
jan 1, 1995
4.177K
+40.337
0.98%
jan 1, 1996
3.913K
-264.024
-6.32%
jan 1, 1997
4.092K
+179.683
4.59%
jan 1, 1998
4.199K
+106.343
2.6%
jan 1, 1999
4.888K
+689.396
16.42%
jan 1, 2000
4.98K
+91.675
1.88%
jan 1, 2001
5.332K
+352.032
7.07%
jan 1, 2002
4.144K
-1.188K
-22.28%
jan 1, 2003
4.668K
+524.381
12.65%
jan 1, 2004
5.192K
+524.381
11.23%
jan 1, 2005
4.998K
-194.351
-3.74%
jan 1, 2006
6.091K
+1.093K
21.86%
jan 1, 2007
5.988K
-102.676
-1.69%
jan 1, 2008
6.582K
+594.054
9.92%
jan 1, 2009
5.864K
-718.732
-10.92%
jan 1, 2010
4.397K
-1.467K
-25.02%
jan 1, 2011
5.453K
+1.056K
24.02%
jan 1, 2012
5.317K
-135.679
-2.49%
jan 1, 2013
4.129K
-1.188K
-22.34%
jan 1, 2014
4.254K
+124.678
3.02%
Ranking of countries by current statistics by years


Comments: