29
/
en
AIzaSyAYiBZKx7MnpbEhh9jyipgxe19OcubqV5w
April 1, 2024
223311
Philippines
PHL
true
2
1
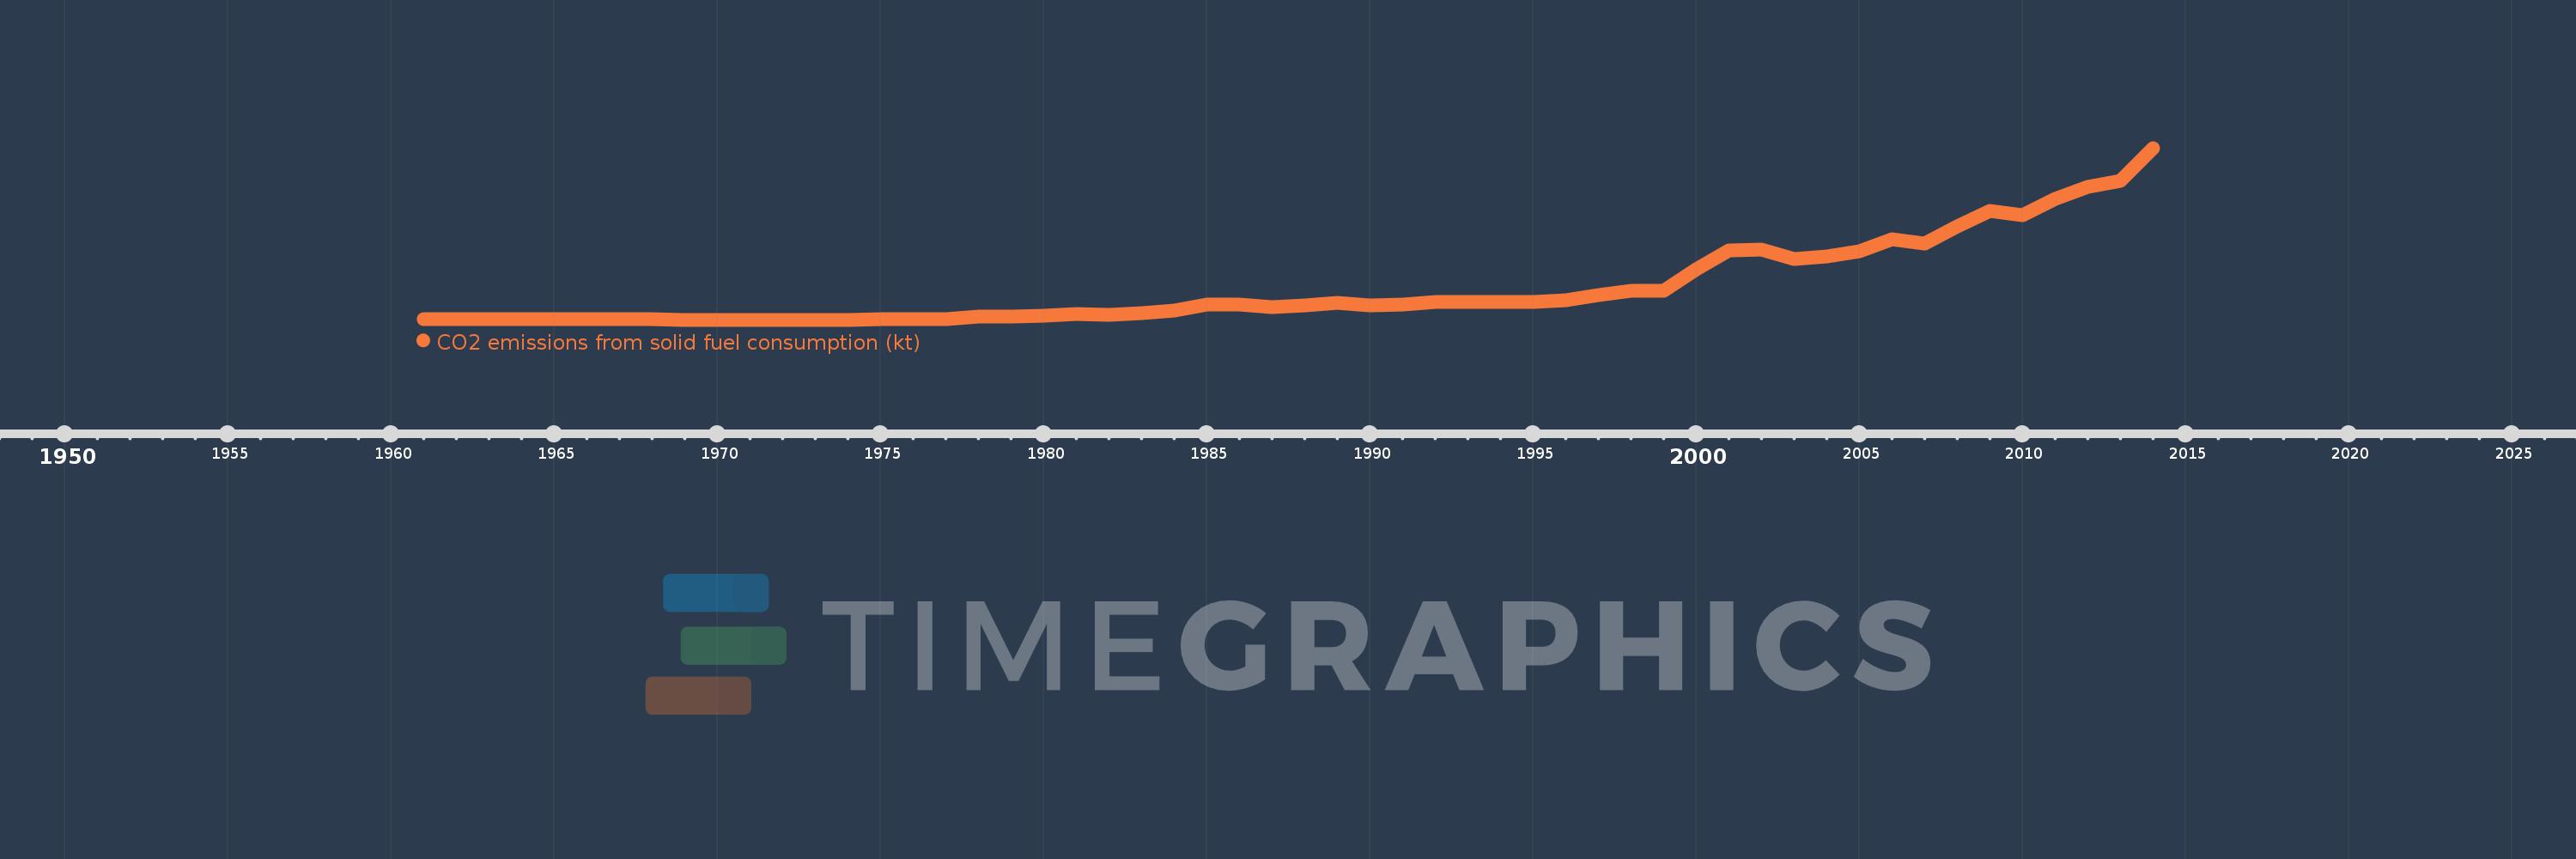
CO2 emissions from solid fuel consumption (kt)
2014,2013,2012,2011,2010,2009,2008,2007,2006,2005,2004,2003,2002,2001,2000,1999,1998,1997,1996,1995,1994,1993,1992,1991,1990,1989,1988,1987,1986,1985,1984,1983,1982,1981,1980,1979,1978,1977,1976,1975,1974,1973,1972,1971,1970,1969,1968,1967,1966,1965,1964,1963,1962,1961
This statistics in other country:
AfghanistanAlbaniaAlgeriaAndorraAngolaAntigua and BarbudaArgentinaArmeniaArubaAustraliaAustriaAzerbaijanBahamas, TheBahrainBangladeshBarbadosBelarusBelgiumBelizeBeninBermudaBhutanBoliviaBosnia and HerzegovinaBotswanaBrazilBritish Virgin IslandsBrunei DarussalamBulgariaBurkina FasoBurundiCabo VerdeCambodiaCameroonCanadaCayman IslandsCentral African RepublicCentral Europe and the BalticsChadChileChinaColombiaComorosCongo, Dem. Rep.Congo, Rep.Costa RicaCote d'IvoireCroatiaCubaCuracaoCyprusCzech RepublicDenmarkDjiboutiDominicaDominican RepublicEarly-demographic dividendEast Asia & PacificEast Asia & Pacific (excluding high income)East Asia & Pacific (IDA & IBRD countries)EcuadorEgypt, Arab Rep.El SalvadorEquatorial GuineaEritreaEstoniaEthiopiaEuro areaEurope & Central AsiaEurope & Central Asia (excluding high income)Europe & Central Asia (IDA & IBRD countries)European UnionFaroe IslandsFijiFinlandFranceFrench PolynesiaGabonGambia, TheGeorgiaGermanyGhanaGibraltarGreeceGreenlandGrenadaGuatemalaGuineaGuinea-BissauGuyanaHaitiHigh incomeHondurasHong Kong SAR, ChinaHungaryIBRD onlyIcelandIDA & IBRD totalIDA blendIDA totalIndiaIndonesiaIran, Islamic Rep.IraqIrelandIsraelItalyJamaicaJapanJordanKazakhstanKenyaKiribatiKorea, Dem. People’s Rep.Korea, Rep.KuwaitKyrgyz RepublicLao PDRLate-demographic dividendLatin America & Caribbean Latin America & Caribbean (excluding high income)Latin America & the Caribbean (IDA & IBRD countries)LatviaLebanonLesothoLiberiaLibyaLiechtensteinLithuaniaLow & middle incomeLower middle incomeLuxembourgMacao SAR, ChinaMacedonia, FYRMadagascarMalawiMalaysiaMaldivesMaliMaltaMarshall IslandsMauritaniaMauritiusMexicoMicronesia, Fed. Sts.Middle East & North Africa (excluding high income)Middle East & North Africa (IDA & IBRD countries)Middle incomeMoldovaMongoliaMontenegroMoroccoMozambiqueMyanmarNamibiaNauruNepalNetherlandsNew CaledoniaNew ZealandNicaraguaNigerNigeriaNorth AmericaNorwayOECD membersOmanPakistanPalauPanamaPapua New GuineaParaguayPeruPhilippinesPolandPortugalPost-demographic dividendQatarRomaniaRussian FederationRwandaSamoaSao Tome and PrincipeSaudi ArabiaSenegalSerbiaSeychellesSierra LeoneSingaporeSint Maarten (Dutch part)Slovak RepublicSloveniaSolomon IslandsSomaliaSouth AfricaSouth AsiaSouth Asia (IDA & IBRD)South SudanSpainSri LankaSt. Kitts and NevisSt. LuciaSt. Vincent and the GrenadinesSudanSurinameSwazilandSwedenSwitzerlandSyrian Arab RepublicTajikistanTanzaniaThailandTimor-LesteTogoTongaTrinidad and TobagoTunisiaTurkeyTurkmenistanTurks and Caicos IslandsUgandaUkraineUnited Arab EmiratesUnited KingdomUnited StatesUpper middle incomeUruguayUzbekistanVanuatuVenezuela, RBVietnamWest Bank and GazaWorldYemen, Rep.ZambiaZimbabwe Timeline:
This timeline shows a graph from 1961 to 2014 of Philippines. No data until 1960. Number of actual observations by date: 54.
Source name:
World Development Indicators
Source organization:
Carbon Dioxide Information Analysis Center, Environmental Sciences Division, Oak Ridge National Laboratory, Tennessee, United States.
Categories, topics:
Climate Change, Environment
Last updated:
apr 23, 2017
Indicators value changes by year
Minimum:
62.339
jan 1, 1974
Maximum:
40.168K
jan 1, 2014
At the date of observation
Value
Absolute change
Change from previous value
jan 1, 1961
179.683
+179.683
0.0%
jan 1, 1962
179.683
0.0
0.0%
jan 1, 1963
212.686
+33.003
18.37%
jan 1, 1964
201.685
-11.001
-5.17%
jan 1, 1965
150.347
-51.338
-25.45%
jan 1, 1966
150.347
0.0
0.0%
jan 1, 1967
135.679
-14.668
-9.76%
jan 1, 1968
106.343
-29.336
-21.62%
jan 1, 1969
88.008
-18.335
-17.24%
jan 1, 1970
77.007
-11.001
-12.5%
jan 1, 1971
84.341
+7.334
9.52%
jan 1, 1972
77.007
-7.334
-8.7%
jan 1, 1973
77.007
0.0
0.0%
jan 1, 1974
62.339
-14.668
-19.05%
jan 1, 1975
113.677
+51.338
82.35%
jan 1, 1976
150.347
+36.67
32.26%
jan 1, 1977
172.349
+22.002
14.63%
jan 1, 1978
722.399
+550.05
319.15%
jan 1, 1979
883.747
+161.348
22.34%
jan 1, 1980
1.1K
+216.353
24.48%
jan 1, 1981
1.349K
+249.356
22.67%
jan 1, 1982
1.294K
-55.005
-4.08%
jan 1, 1983
1.61K
+315.362
24.36%
jan 1, 1984
2.2K
+590.387
36.67%
jan 1, 1985
3.564K
+1.364K
62.0%
jan 1, 1986
3.641K
+77.007
2.16%
jan 1, 1987
2.934K
-707.731
-19.44%
jan 1, 1988
3.458K
+524.381
17.88%
jan 1, 1989
3.938K
+480.377
13.89%
jan 1, 1990
3.333K
-605.055
-15.36%
jan 1, 1991
3.608K
+275.025
8.25%
jan 1, 1992
4.133K
+524.381
14.53%
jan 1, 1993
4.228K
+95.342
2.31%
jan 1, 1994
4.195K
-33.003
-0.78%
jan 1, 1995
4.184K
-11.001
-0.26%
jan 1, 1996
4.697K
+513.38
12.27%
jan 1, 1997
5.908K
+1.21K
25.76%
jan 1, 1998
6.795K
+887.414
15.02%
jan 1, 1999
6.865K
+69.673
1.03%
jan 1, 2000
11.885K
+5.02K
73.13%
jan 1, 2001
16.314K
+4.43K
37.27%
jan 1, 2002
16.377K
+62.339
0.38%
jan 1, 2003
14.309K
-2.068K
-12.63%
jan 1, 2004
14.87K
+561.051
3.92%
jan 1, 2005
16.113K
+1.243K
8.36%
jan 1, 2006
18.79K
+2.677K
16.61%
jan 1, 2007
17.796K
-993.757
-5.29%
jan 1, 2008
21.907K
+4.111K
23.1%
jan 1, 2009
25.475K
+3.568K
16.29%
jan 1, 2010
24.386K
-1.089K
-4.28%
jan 1, 2011
28.276K
+3.891K
15.95%
jan 1, 2012
31.133K
+2.857K
10.1%
jan 1, 2013
32.585K
+1.452K
4.66%
jan 1, 2014
40.168K
+7.583K
23.27%
Ranking of countries by current statistics by years


Comments: