29
/
en
AIzaSyAYiBZKx7MnpbEhh9jyipgxe19OcubqV5w
April 1, 2024
25557
Central Europe and the Baltics
CEB
false
2
1
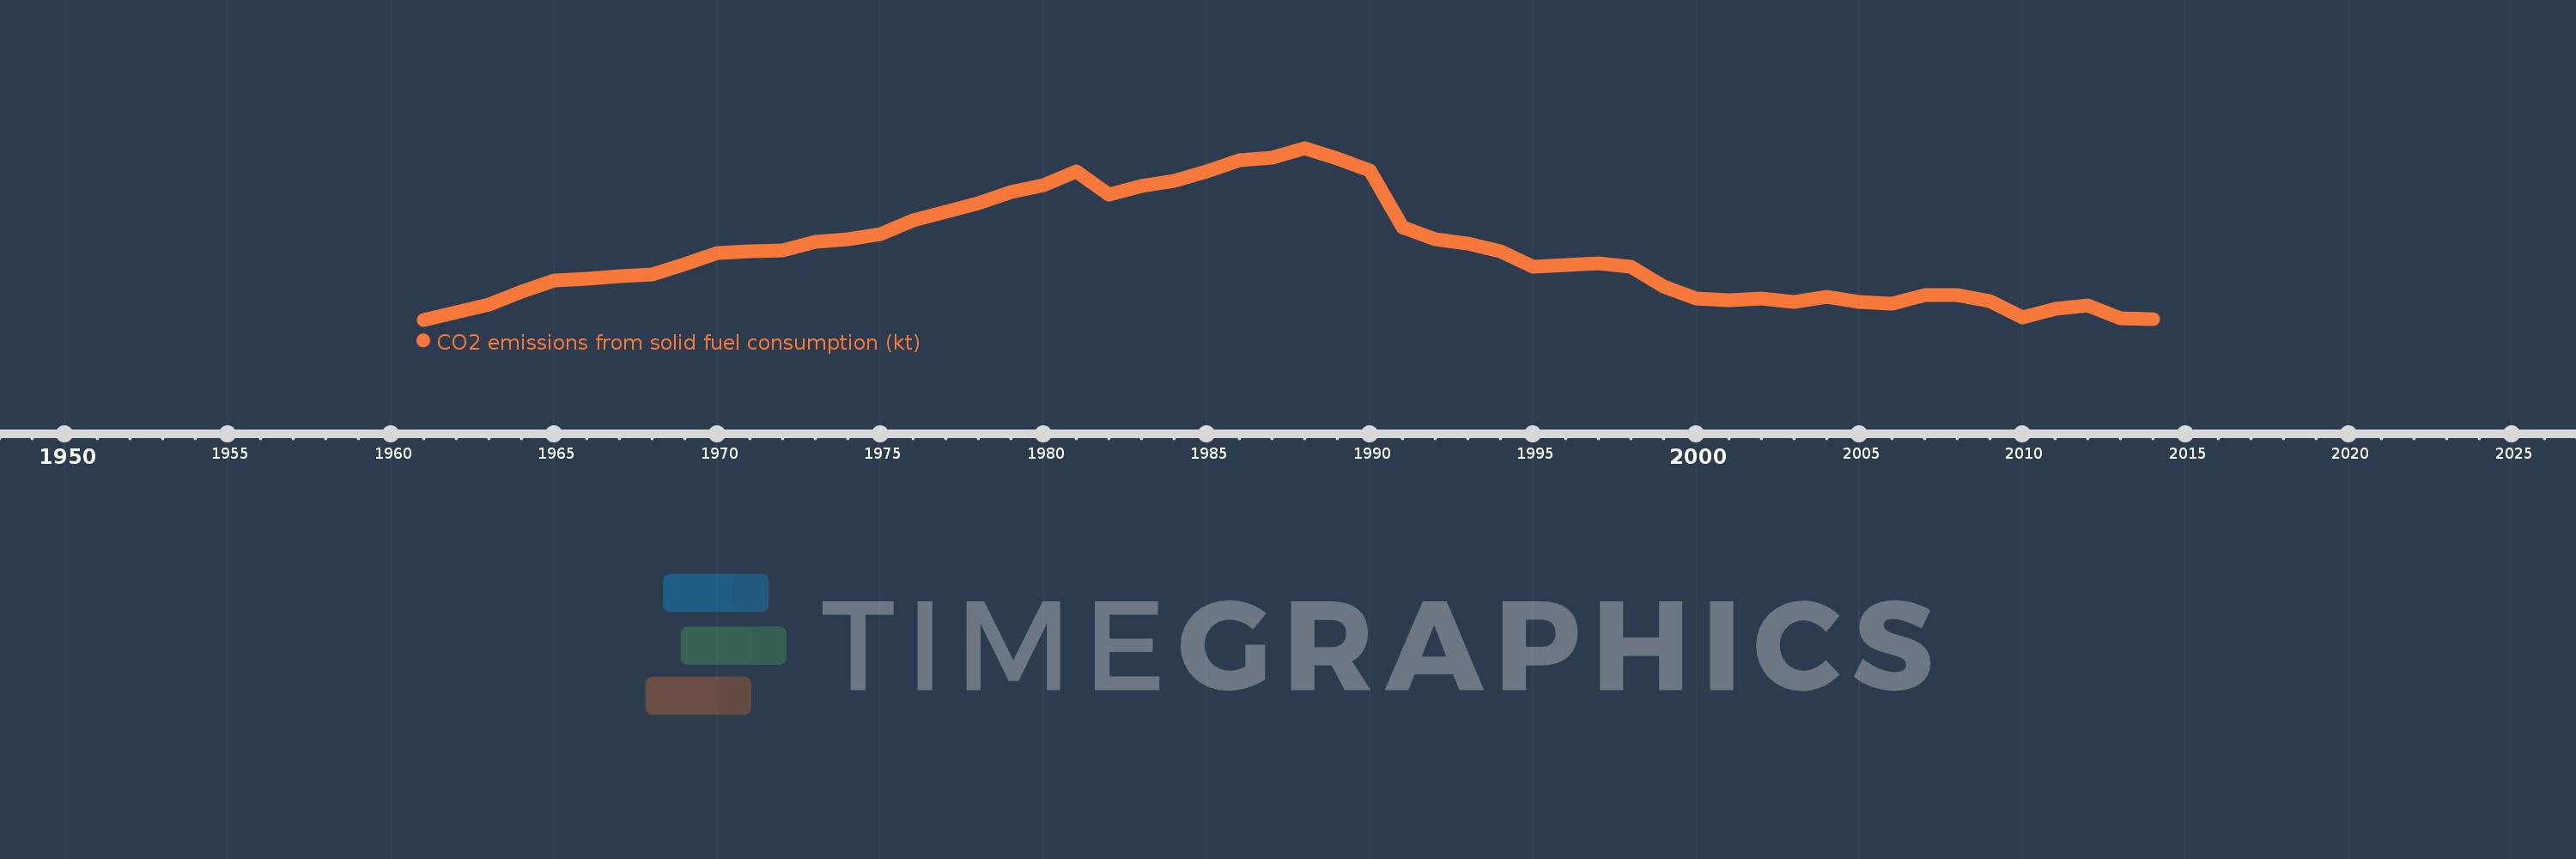
CO2 emissions from solid fuel consumption (kt)
2014,2013,2012,2011,2010,2009,2008,2007,2006,2005,2004,2003,2002,2001,2000,1999,1998,1997,1996,1995,1994,1993,1992,1991,1990,1989,1988,1987,1986,1985,1984,1983,1982,1981,1980,1979,1978,1977,1976,1975,1974,1973,1972,1971,1970,1969,1968,1967,1966,1965,1964,1963,1962,1961
This statistics in other country:
AfghanistanAlbaniaAlgeriaAndorraAngolaAntigua and BarbudaArgentinaArmeniaArubaAustraliaAustriaAzerbaijanBahamas, TheBahrainBangladeshBarbadosBelarusBelgiumBelizeBeninBermudaBhutanBoliviaBosnia and HerzegovinaBotswanaBrazilBritish Virgin IslandsBrunei DarussalamBulgariaBurkina FasoBurundiCabo VerdeCambodiaCameroonCanadaCayman IslandsCentral African RepublicCentral Europe and the BalticsChadChileChinaColombiaComorosCongo, Dem. Rep.Congo, Rep.Costa RicaCote d'IvoireCroatiaCubaCuracaoCyprusCzech RepublicDenmarkDjiboutiDominicaDominican RepublicEarly-demographic dividendEast Asia & PacificEast Asia & Pacific (excluding high income)East Asia & Pacific (IDA & IBRD countries)EcuadorEgypt, Arab Rep.El SalvadorEquatorial GuineaEritreaEstoniaEthiopiaEuro areaEurope & Central AsiaEurope & Central Asia (excluding high income)Europe & Central Asia (IDA & IBRD countries)European UnionFaroe IslandsFijiFinlandFranceFrench PolynesiaGabonGambia, TheGeorgiaGermanyGhanaGibraltarGreeceGreenlandGrenadaGuatemalaGuineaGuinea-BissauGuyanaHaitiHigh incomeHondurasHong Kong SAR, ChinaHungaryIBRD onlyIcelandIDA & IBRD totalIDA blendIDA totalIndiaIndonesiaIran, Islamic Rep.IraqIrelandIsraelItalyJamaicaJapanJordanKazakhstanKenyaKiribatiKorea, Dem. People’s Rep.Korea, Rep.KuwaitKyrgyz RepublicLao PDRLate-demographic dividendLatin America & Caribbean Latin America & Caribbean (excluding high income)Latin America & the Caribbean (IDA & IBRD countries)LatviaLebanonLesothoLiberiaLibyaLiechtensteinLithuaniaLow & middle incomeLower middle incomeLuxembourgMacao SAR, ChinaMacedonia, FYRMadagascarMalawiMalaysiaMaldivesMaliMaltaMarshall IslandsMauritaniaMauritiusMexicoMicronesia, Fed. Sts.Middle East & North Africa (excluding high income)Middle East & North Africa (IDA & IBRD countries)Middle incomeMoldovaMongoliaMontenegroMoroccoMozambiqueMyanmarNamibiaNauruNepalNetherlandsNew CaledoniaNew ZealandNicaraguaNigerNigeriaNorth AmericaNorwayOECD membersOmanPakistanPalauPanamaPapua New GuineaParaguayPeruPhilippinesPolandPortugalPost-demographic dividendQatarRomaniaRussian FederationRwandaSamoaSao Tome and PrincipeSaudi ArabiaSenegalSerbiaSeychellesSierra LeoneSingaporeSint Maarten (Dutch part)Slovak RepublicSloveniaSolomon IslandsSomaliaSouth AfricaSouth AsiaSouth Asia (IDA & IBRD)South SudanSpainSri LankaSt. Kitts and NevisSt. LuciaSt. Vincent and the GrenadinesSudanSurinameSwazilandSwedenSwitzerlandSyrian Arab RepublicTajikistanTanzaniaThailandTimor-LesteTogoTongaTrinidad and TobagoTunisiaTurkeyTurkmenistanTurks and Caicos IslandsUgandaUkraineUnited Arab EmiratesUnited KingdomUnited StatesUpper middle incomeUruguayUzbekistanVanuatuVenezuela, RBVietnamWest Bank and GazaWorldYemen, Rep.ZambiaZimbabwe Timeline:
This timeline shows a graph from 1961 to 2014 of Central Europe and the Baltics. No data until 1960. Number of actual observations by date: 54.
Source name:
World Development Indicators
Source organization:
Carbon Dioxide Information Analysis Center, Environmental Sciences Division, Oak Ridge National Laboratory, Tennessee, United States.
Categories, topics:
Climate Change, Environment
Last updated:
apr 23, 2017
Indicators value changes by year
Minimum:
363.634K
jan 1, 1961
Maximum:
768.311K
jan 1, 1988
At the date of observation
Value
Absolute change
Change from previous value
jan 1, 1961
363.634K
+363.634K
0.0%
jan 1, 1962
380.501K
+16.867K
4.64%
jan 1, 1963
400.082K
+19.581K
5.15%
jan 1, 1964
429.503K
+29.421K
7.35%
jan 1, 1965
457.001K
+27.498K
6.4%
jan 1, 1966
459.694K
+2.694K
0.59%
jan 1, 1967
466.028K
+6.333K
1.38%
jan 1, 1968
471.21K
+5.182K
1.11%
jan 1, 1969
493.912K
+22.702K
4.82%
jan 1, 1970
519.878K
+25.966K
5.26%
jan 1, 1971
524.026K
+4.149K
0.8%
jan 1, 1972
526.381K
+2.354K
0.45%
jan 1, 1973
546.635K
+20.255K
3.85%
jan 1, 1974
553.704K
+7.069K
1.29%
jan 1, 1975
564.567K
+10.862K
1.96%
jan 1, 1976
597.061K
+32.495K
5.76%
jan 1, 1977
617.661K
+20.599K
3.45%
jan 1, 1978
638.373K
+20.712K
3.35%
jan 1, 1979
665.007K
+26.634K
4.17%
jan 1, 1980
681.242K
+16.235K
2.44%
jan 1, 1981
712.22K
+30.978K
4.55%
jan 1, 1982
659.378K
-52.842K
-7.42%
jan 1, 1983
679.114K
+19.735K
2.99%
jan 1, 1984
691.811K
+12.698K
1.87%
jan 1, 1985
713.978K
+22.167K
3.2%
jan 1, 1986
740.016K
+26.038K
3.65%
jan 1, 1987
744.51K
+4.493K
0.61%
jan 1, 1988
768.311K
+23.802K
3.2%
jan 1, 1989
744.073K
-24.239K
-3.15%
jan 1, 1990
714.107K
-29.966K
-4.03%
jan 1, 1991
582.415K
-131.692K
-18.44%
jan 1, 1992
552.383K
-30.032K
-5.16%
jan 1, 1993
542.199K
-10.184K
-1.84%
jan 1, 1994
524.99K
-17.209K
-3.17%
jan 1, 1995
489.343K
-35.647K
-6.79%
jan 1, 1996
492.76K
+3.418K
0.7%
jan 1, 1997
496.93K
+4.169K
0.85%
jan 1, 1998
487.557K
-9.373K
-1.89%
jan 1, 1999
442.38K
-45.177K
-9.27%
jan 1, 2000
413.341K
-29.039K
-6.56%
jan 1, 2001
410.44K
-2.901K
-0.7%
jan 1, 2002
414.206K
+3.766K
0.92%
jan 1, 2003
404.573K
-9.633K
-2.33%
jan 1, 2004
417.521K
+12.948K
3.2%
jan 1, 2005
406.043K
-11.478K
-2.75%
jan 1, 2006
402.428K
-3.616K
-0.89%
jan 1, 2007
421.309K
+18.881K
4.69%
jan 1, 2008
421.32K
+11.001
0.0%
jan 1, 2009
407.462K
-13.858K
-3.29%
jan 1, 2010
369.406K
-38.056K
-9.34%
jan 1, 2011
389.923K
+20.517K
5.55%
jan 1, 2012
397.198K
+7.275K
1.87%
jan 1, 2013
367.301K
-29.897K
-7.53%
jan 1, 2014
364.43K
-2.871K
-0.78%
Ranking of countries by current statistics by years


Comments: