29
/
en
AIzaSyAYiBZKx7MnpbEhh9jyipgxe19OcubqV5w
April 1, 2024
163587
Japan
JPN
true
2
1
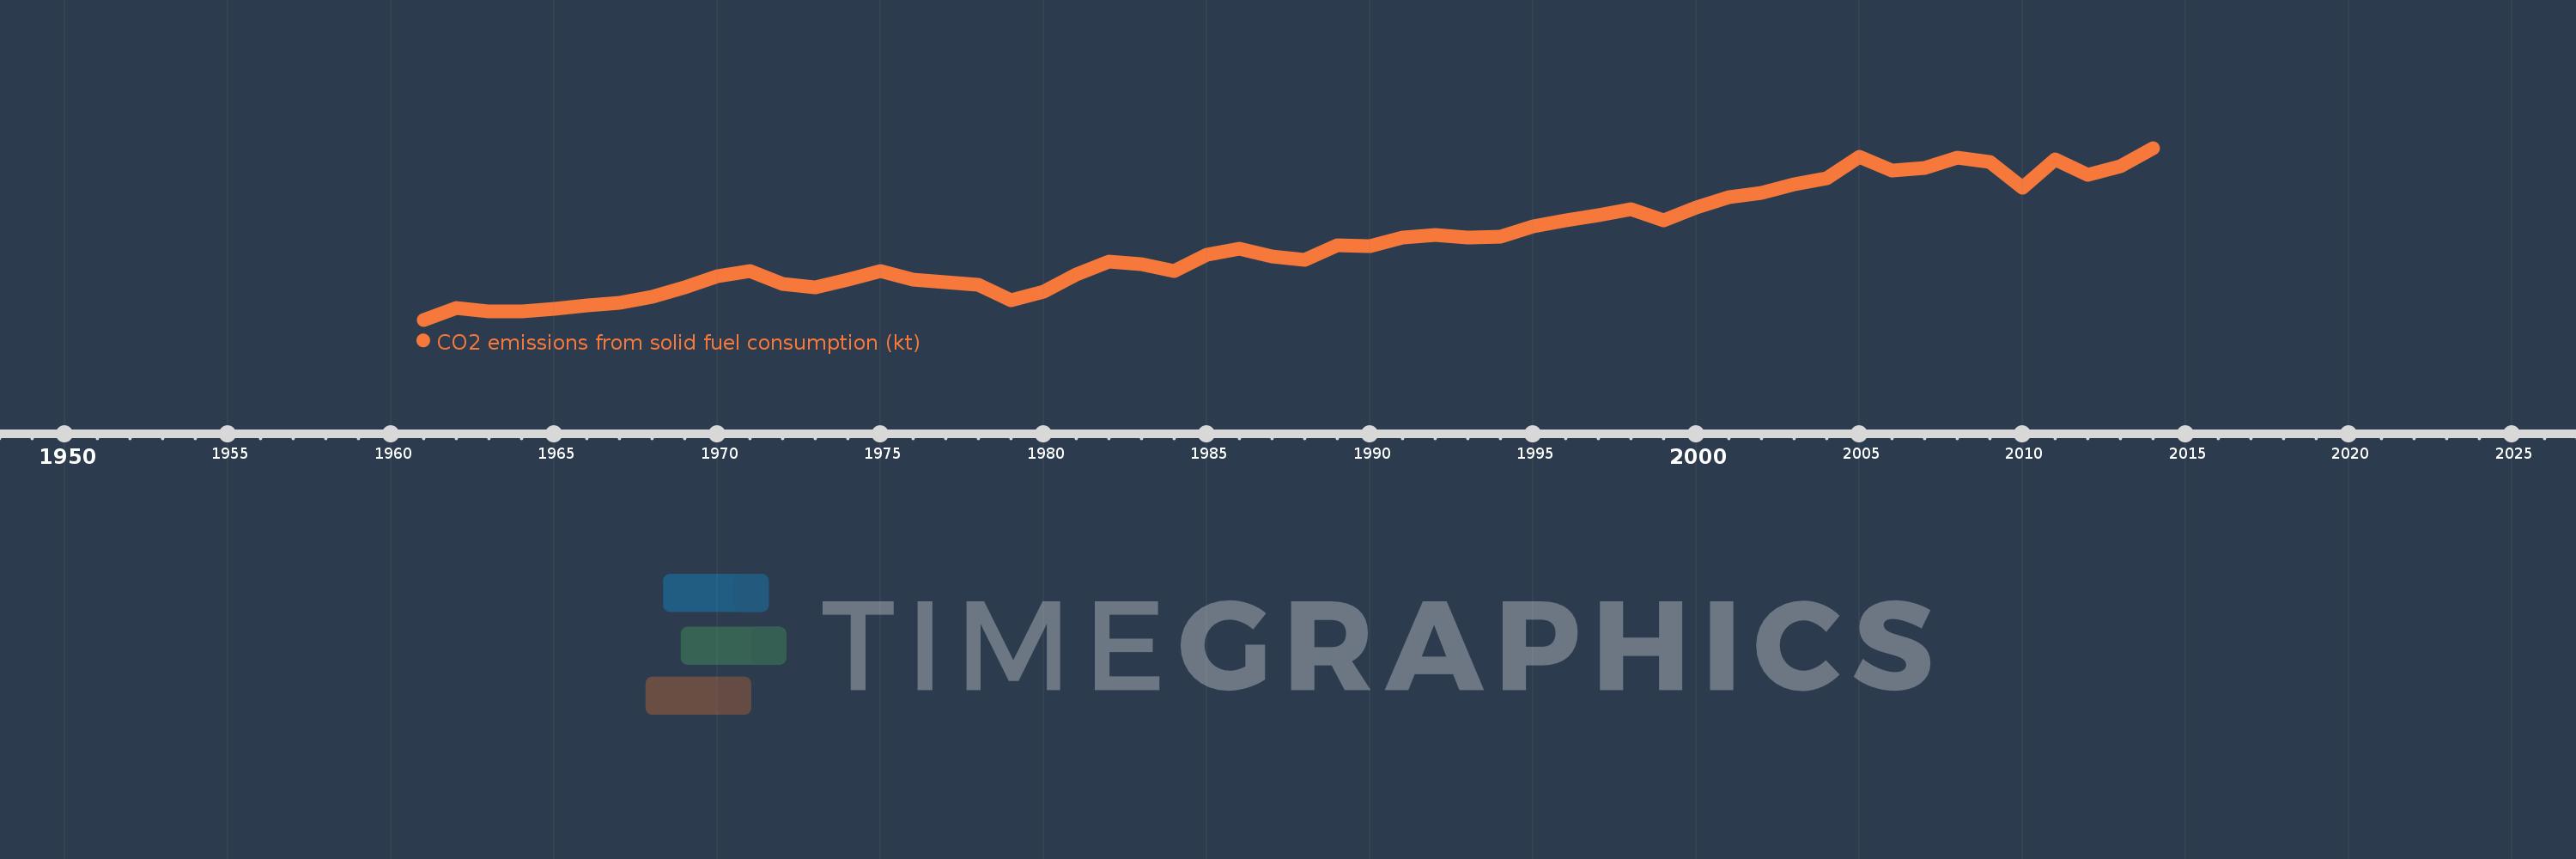
CO2 emissions from solid fuel consumption (kt)
2014,2013,2012,2011,2010,2009,2008,2007,2006,2005,2004,2003,2002,2001,2000,1999,1998,1997,1996,1995,1994,1993,1992,1991,1990,1989,1988,1987,1986,1985,1984,1983,1982,1981,1980,1979,1978,1977,1976,1975,1974,1973,1972,1971,1970,1969,1968,1967,1966,1965,1964,1963,1962,1961
This statistics in other country:
AfghanistanAlbaniaAlgeriaAndorraAngolaAntigua and BarbudaArgentinaArmeniaArubaAustraliaAustriaAzerbaijanBahamas, TheBahrainBangladeshBarbadosBelarusBelgiumBelizeBeninBermudaBhutanBoliviaBosnia and HerzegovinaBotswanaBrazilBritish Virgin IslandsBrunei DarussalamBulgariaBurkina FasoBurundiCabo VerdeCambodiaCameroonCanadaCayman IslandsCentral African RepublicCentral Europe and the BalticsChadChileChinaColombiaComorosCongo, Dem. Rep.Congo, Rep.Costa RicaCote d'IvoireCroatiaCubaCuracaoCyprusCzech RepublicDenmarkDjiboutiDominicaDominican RepublicEarly-demographic dividendEast Asia & PacificEast Asia & Pacific (excluding high income)East Asia & Pacific (IDA & IBRD countries)EcuadorEgypt, Arab Rep.El SalvadorEquatorial GuineaEritreaEstoniaEthiopiaEuro areaEurope & Central AsiaEurope & Central Asia (excluding high income)Europe & Central Asia (IDA & IBRD countries)European UnionFaroe IslandsFijiFinlandFranceFrench PolynesiaGabonGambia, TheGeorgiaGermanyGhanaGibraltarGreeceGreenlandGrenadaGuatemalaGuineaGuinea-BissauGuyanaHaitiHigh incomeHondurasHong Kong SAR, ChinaHungaryIBRD onlyIcelandIDA & IBRD totalIDA blendIDA totalIndiaIndonesiaIran, Islamic Rep.IraqIrelandIsraelItalyJamaicaJapanJordanKazakhstanKenyaKiribatiKorea, Dem. People’s Rep.Korea, Rep.KuwaitKyrgyz RepublicLao PDRLate-demographic dividendLatin America & Caribbean Latin America & Caribbean (excluding high income)Latin America & the Caribbean (IDA & IBRD countries)LatviaLebanonLesothoLiberiaLibyaLiechtensteinLithuaniaLow & middle incomeLower middle incomeLuxembourgMacao SAR, ChinaMacedonia, FYRMadagascarMalawiMalaysiaMaldivesMaliMaltaMarshall IslandsMauritaniaMauritiusMexicoMicronesia, Fed. Sts.Middle East & North Africa (excluding high income)Middle East & North Africa (IDA & IBRD countries)Middle incomeMoldovaMongoliaMontenegroMoroccoMozambiqueMyanmarNamibiaNauruNepalNetherlandsNew CaledoniaNew ZealandNicaraguaNigerNigeriaNorth AmericaNorwayOECD membersOmanPakistanPalauPanamaPapua New GuineaParaguayPeruPhilippinesPolandPortugalPost-demographic dividendQatarRomaniaRussian FederationRwandaSamoaSao Tome and PrincipeSaudi ArabiaSenegalSerbiaSeychellesSierra LeoneSingaporeSint Maarten (Dutch part)Slovak RepublicSloveniaSolomon IslandsSomaliaSouth AfricaSouth AsiaSouth Asia (IDA & IBRD)South SudanSpainSri LankaSt. Kitts and NevisSt. LuciaSt. Vincent and the GrenadinesSudanSurinameSwazilandSwedenSwitzerlandSyrian Arab RepublicTajikistanTanzaniaThailandTimor-LesteTogoTongaTrinidad and TobagoTunisiaTurkeyTurkmenistanTurks and Caicos IslandsUgandaUkraineUnited Arab EmiratesUnited KingdomUnited StatesUpper middle incomeUruguayUzbekistanVanuatuVenezuela, RBVietnamWest Bank and GazaWorldYemen, Rep.ZambiaZimbabwe Timeline:
This timeline shows a graph from 1961 to 2014 of Japan. No data until 1960. Number of actual observations by date: 54.
Source name:
World Development Indicators
Source organization:
Carbon Dioxide Information Analysis Center, Environmental Sciences Division, Oak Ridge National Laboratory, Tennessee, United States.
Categories, topics:
Climate Change, Environment
Last updated:
apr 23, 2017
Indicators value changes by year
Minimum:
139.258K
jan 1, 1961
Maximum:
459.655K
jan 1, 2014
At the date of observation
Value
Absolute change
Change from previous value
jan 1, 1961
139.258K
+139.258K
0.0%
jan 1, 1962
160.996K
+21.738K
15.61%
jan 1, 1963
154.34K
-6.656K
-4.13%
jan 1, 1964
155.466K
+1.126K
0.73%
jan 1, 1965
160.34K
+4.873K
3.13%
jan 1, 1966
165.884K
+5.545K
3.46%
jan 1, 1967
170.589K
+4.705K
2.84%
jan 1, 1968
181.649K
+11.06K
6.48%
jan 1, 1969
200.284K
+18.636K
10.26%
jan 1, 1970
221.204K
+20.92K
10.45%
jan 1, 1971
229.452K
+8.247K
3.73%
jan 1, 1972
206.555K
-22.897K
-9.98%
jan 1, 1973
200.38K
-6.175K
-2.99%
jan 1, 1974
214.56K
+14.18K
7.08%
jan 1, 1975
229.378K
+14.818K
6.91%
jan 1, 1976
213.595K
-15.783K
-6.88%
jan 1, 1977
208.553K
-5.042K
-2.36%
jan 1, 1978
204.688K
-3.865K
-1.85%
jan 1, 1979
174.883K
-29.805K
-14.56%
jan 1, 1980
191.095K
+16.212K
9.27%
jan 1, 1981
224.483K
+33.388K
17.47%
jan 1, 1982
247.559K
+23.076K
10.28%
jan 1, 1983
242.829K
-4.73K
-1.91%
jan 1, 1984
229.983K
-12.846K
-5.29%
jan 1, 1985
260.39K
+30.407K
13.22%
jan 1, 1986
272.011K
+11.621K
4.46%
jan 1, 1987
257.676K
-14.334K
-5.27%
jan 1, 1988
250.599K
-7.077K
-2.75%
jan 1, 1989
278.74K
+28.141K
11.23%
jan 1, 1990
277.332K
-1.408K
-0.51%
jan 1, 1991
291.89K
+14.558K
5.25%
jan 1, 1992
297.005K
+5.115K
1.75%
jan 1, 1993
292.121K
-4.884K
-1.64%
jan 1, 1994
294.687K
+2.567K
0.88%
jan 1, 1995
313.206K
+18.518K
6.28%
jan 1, 1996
325.223K
+12.017K
3.84%
jan 1, 1997
334.691K
+9.468K
2.91%
jan 1, 1998
344.804K
+10.114K
3.02%
jan 1, 1999
324.324K
-20.48K
-5.94%
jan 1, 2000
349.117K
+24.793K
7.64%
jan 1, 2001
368.346K
+19.23K
5.51%
jan 1, 2002
376.454K
+8.108K
2.2%
jan 1, 2003
391.108K
+14.653K
3.89%
jan 1, 2004
403.869K
+12.761K
3.26%
jan 1, 2005
443.256K
+39.387K
9.75%
jan 1, 2006
417.895K
-25.361K
-5.72%
jan 1, 2007
422.31K
+4.415K
1.06%
jan 1, 2008
441.885K
+19.574K
4.64%
jan 1, 2009
433.45K
-8.434K
-1.91%
jan 1, 2010
386.036K
-47.414K
-10.94%
jan 1, 2011
438.852K
+52.816K
13.68%
jan 1, 2012
410.161K
-28.691K
-6.54%
jan 1, 2013
425.445K
+15.284K
3.73%
jan 1, 2014
459.655K
+34.209K
8.04%
Ranking of countries by current statistics by years


Comments: