29
/
en
AIzaSyAYiBZKx7MnpbEhh9jyipgxe19OcubqV5w
April 1, 2024
203932
Myanmar
MMR
true
2
1
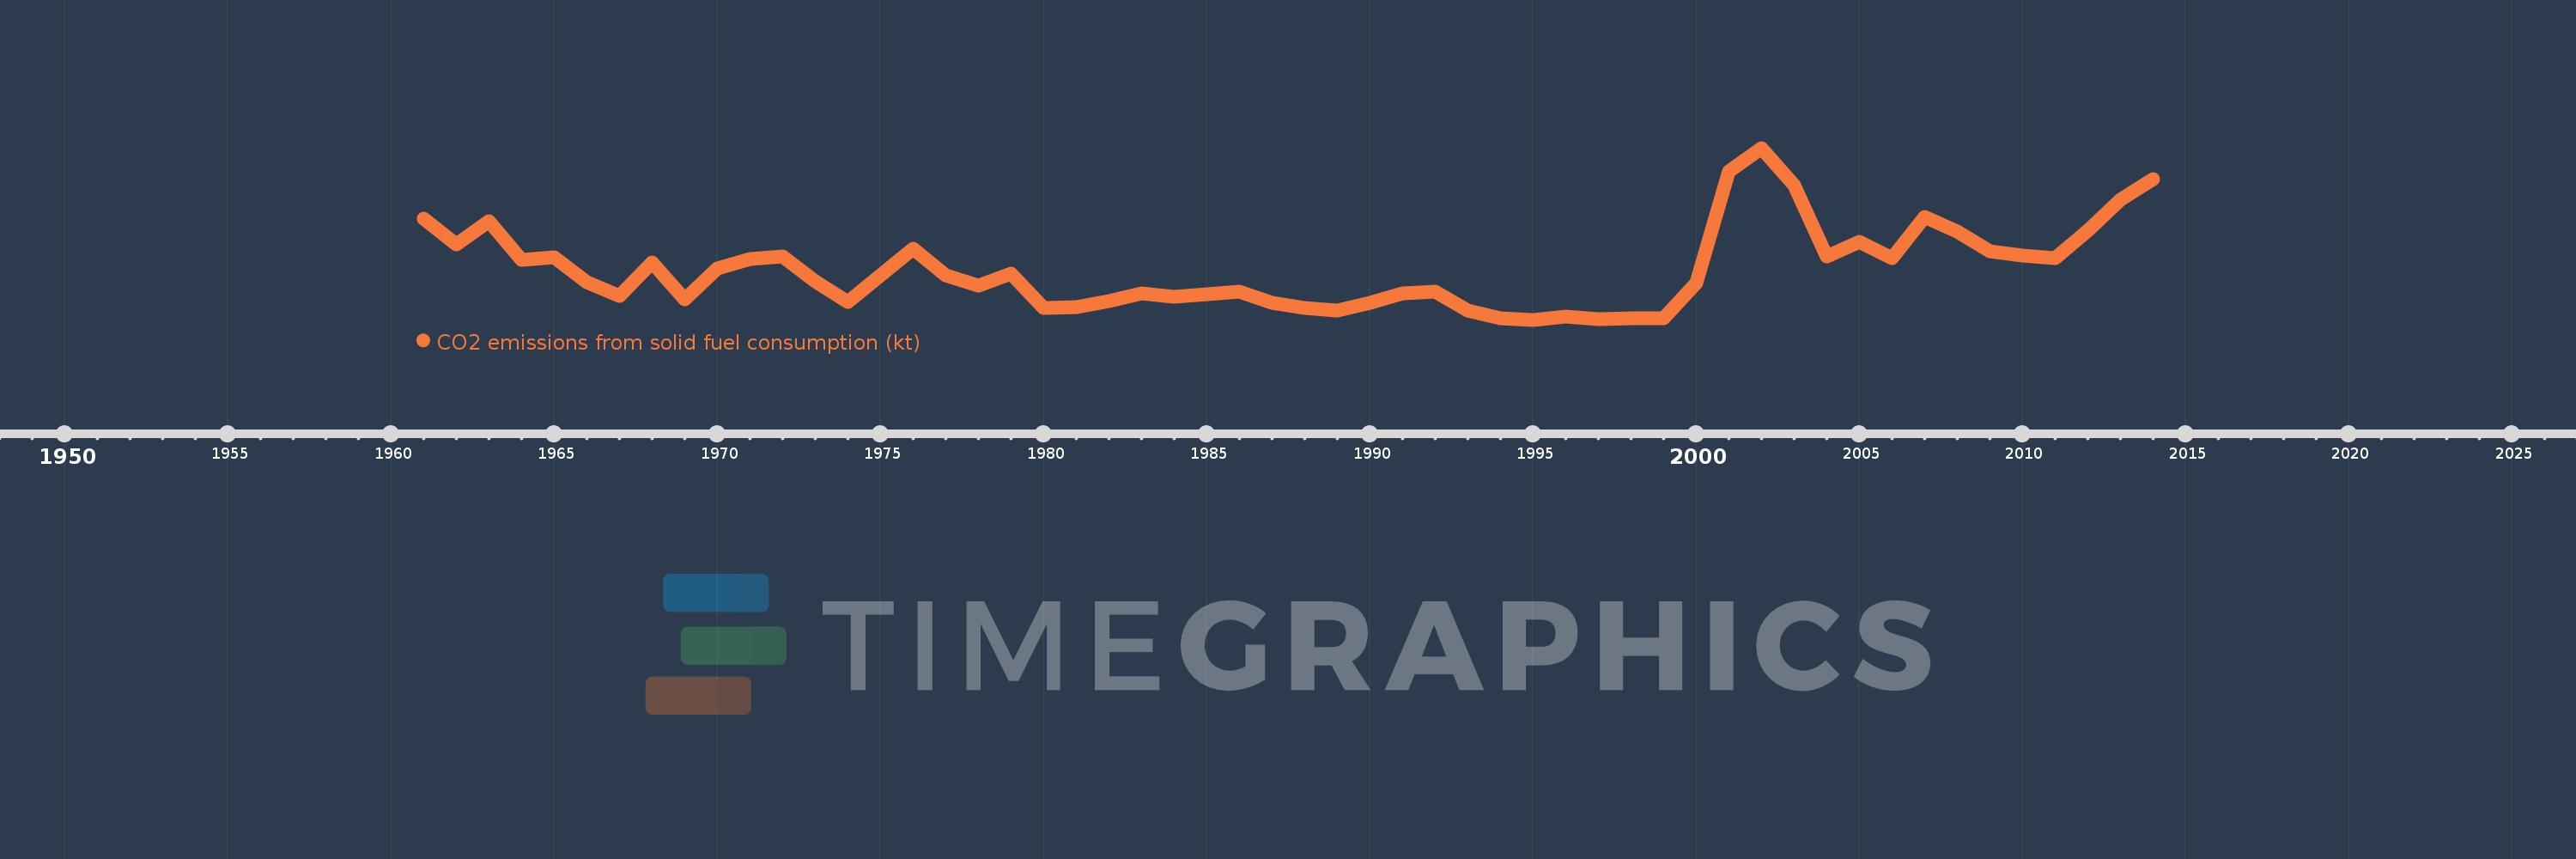
CO2 emissions from solid fuel consumption (kt)
2014,2013,2012,2011,2010,2009,2008,2007,2006,2005,2004,2003,2002,2001,2000,1999,1998,1997,1996,1995,1994,1993,1992,1991,1990,1989,1988,1987,1986,1985,1984,1983,1982,1981,1980,1979,1978,1977,1976,1975,1974,1973,1972,1971,1970,1969,1968,1967,1966,1965,1964,1963,1962,1961
This statistics in other country:
AfghanistanAlbaniaAlgeriaAndorraAngolaAntigua and BarbudaArgentinaArmeniaArubaAustraliaAustriaAzerbaijanBahamas, TheBahrainBangladeshBarbadosBelarusBelgiumBelizeBeninBermudaBhutanBoliviaBosnia and HerzegovinaBotswanaBrazilBritish Virgin IslandsBrunei DarussalamBulgariaBurkina FasoBurundiCabo VerdeCambodiaCameroonCanadaCayman IslandsCentral African RepublicCentral Europe and the BalticsChadChileChinaColombiaComorosCongo, Dem. Rep.Congo, Rep.Costa RicaCote d'IvoireCroatiaCubaCuracaoCyprusCzech RepublicDenmarkDjiboutiDominicaDominican RepublicEarly-demographic dividendEast Asia & PacificEast Asia & Pacific (excluding high income)East Asia & Pacific (IDA & IBRD countries)EcuadorEgypt, Arab Rep.El SalvadorEquatorial GuineaEritreaEstoniaEthiopiaEuro areaEurope & Central AsiaEurope & Central Asia (excluding high income)Europe & Central Asia (IDA & IBRD countries)European UnionFaroe IslandsFijiFinlandFranceFrench PolynesiaGabonGambia, TheGeorgiaGermanyGhanaGibraltarGreeceGreenlandGrenadaGuatemalaGuineaGuinea-BissauGuyanaHaitiHigh incomeHondurasHong Kong SAR, ChinaHungaryIBRD onlyIcelandIDA & IBRD totalIDA blendIDA totalIndiaIndonesiaIran, Islamic Rep.IraqIrelandIsraelItalyJamaicaJapanJordanKazakhstanKenyaKiribatiKorea, Dem. People’s Rep.Korea, Rep.KuwaitKyrgyz RepublicLao PDRLate-demographic dividendLatin America & Caribbean Latin America & Caribbean (excluding high income)Latin America & the Caribbean (IDA & IBRD countries)LatviaLebanonLesothoLiberiaLibyaLiechtensteinLithuaniaLow & middle incomeLower middle incomeLuxembourgMacao SAR, ChinaMacedonia, FYRMadagascarMalawiMalaysiaMaldivesMaliMaltaMarshall IslandsMauritaniaMauritiusMexicoMicronesia, Fed. Sts.Middle East & North Africa (excluding high income)Middle East & North Africa (IDA & IBRD countries)Middle incomeMoldovaMongoliaMontenegroMoroccoMozambiqueMyanmarNamibiaNauruNepalNetherlandsNew CaledoniaNew ZealandNicaraguaNigerNigeriaNorth AmericaNorwayOECD membersOmanPakistanPalauPanamaPapua New GuineaParaguayPeruPhilippinesPolandPortugalPost-demographic dividendQatarRomaniaRussian FederationRwandaSamoaSao Tome and PrincipeSaudi ArabiaSenegalSerbiaSeychellesSierra LeoneSingaporeSint Maarten (Dutch part)Slovak RepublicSloveniaSolomon IslandsSomaliaSouth AfricaSouth AsiaSouth Asia (IDA & IBRD)South SudanSpainSri LankaSt. Kitts and NevisSt. LuciaSt. Vincent and the GrenadinesSudanSurinameSwazilandSwedenSwitzerlandSyrian Arab RepublicTajikistanTanzaniaThailandTimor-LesteTogoTongaTrinidad and TobagoTunisiaTurkeyTurkmenistanTurks and Caicos IslandsUgandaUkraineUnited Arab EmiratesUnited KingdomUnited StatesUpper middle incomeUruguayUzbekistanVanuatuVenezuela, RBVietnamWest Bank and GazaWorldYemen, Rep.ZambiaZimbabwe Timeline:
This timeline shows a graph from 1961 to 2014 of Myanmar. No data until 1960. Number of actual observations by date: 54.
Source name:
World Development Indicators
Source organization:
Carbon Dioxide Information Analysis Center, Environmental Sciences Division, Oak Ridge National Laboratory, Tennessee, United States.
Categories, topics:
Climate Change, Environment
Last updated:
apr 23, 2017
Indicators value changes by year
Minimum:
40.337
jan 1, 1995
Maximum:
1.566K
jan 1, 2002
At the date of observation
Value
Absolute change
Change from previous value
jan 1, 1961
938.752
+938.752
0.0%
jan 1, 1962
707.731
-231.021
-24.61%
jan 1, 1963
916.75
+209.019
29.53%
jan 1, 1964
575.719
-341.031
-37.2%
jan 1, 1965
594.054
+18.335
3.18%
jan 1, 1966
370.367
-223.687
-37.65%
jan 1, 1967
253.023
-117.344
-31.68%
jan 1, 1968
550.05
+297.027
117.39%
jan 1, 1969
220.02
-330.03
-60.0%
jan 1, 1970
498.712
+278.692
126.67%
jan 1, 1971
583.053
+84.341
16.91%
jan 1, 1972
601.388
+18.335
3.14%
jan 1, 1973
381.368
-220.02
-36.59%
jan 1, 1974
201.685
-179.683
-47.12%
jan 1, 1975
436.373
+234.688
116.36%
jan 1, 1976
671.061
+234.688
53.78%
jan 1, 1977
436.373
-234.688
-34.97%
jan 1, 1978
344.698
-91.675
-21.01%
jan 1, 1979
447.374
+102.676
29.79%
jan 1, 1980
143.013
-304.361
-68.03%
jan 1, 1981
154.014
+11.001
7.69%
jan 1, 1982
205.352
+51.338
33.33%
jan 1, 1983
271.358
+66.006
32.14%
jan 1, 1984
242.022
-29.336
-10.81%
jan 1, 1985
267.691
+25.669
10.61%
jan 1, 1986
289.693
+22.002
8.22%
jan 1, 1987
187.017
-102.676
-35.44%
jan 1, 1988
146.68
-40.337
-21.57%
jan 1, 1989
121.011
-25.669
-17.5%
jan 1, 1990
187.017
+66.006
54.55%
jan 1, 1991
275.025
+88.008
47.06%
jan 1, 1992
289.693
+14.668
5.33%
jan 1, 1993
121.011
-168.682
-58.23%
jan 1, 1994
51.338
-69.673
-57.58%
jan 1, 1995
40.337
-11.001
-21.43%
jan 1, 1996
66.006
+25.669
63.64%
jan 1, 1997
47.671
-18.335
-27.78%
jan 1, 1998
51.338
+3.667
7.69%
jan 1, 1999
55.005
+3.667
7.14%
jan 1, 2000
366.7
+311.695
566.67%
jan 1, 2001
1.36K
+993.757
271.0%
jan 1, 2002
1.566K
+205.352
15.09%
jan 1, 2003
1.236K
-330.03
-21.08%
jan 1, 2004
601.388
-634.391
-51.34%
jan 1, 2005
729.733
+128.345
21.34%
jan 1, 2006
586.72
-143.013
-19.6%
jan 1, 2007
953.42
+366.7
62.5%
jan 1, 2008
821.408
-132.012
-13.85%
jan 1, 2009
649.059
-172.349
-20.98%
jan 1, 2010
608.722
-40.337
-6.21%
jan 1, 2011
586.72
-22.002
-3.61%
jan 1, 2012
832.409
+245.689
41.87%
jan 1, 2013
1.104K
+271.358
32.6%
jan 1, 2014
1.291K
+187.017
16.94%
Ranking of countries by current statistics by years


Comments: