29
/
en
AIzaSyAYiBZKx7MnpbEhh9jyipgxe19OcubqV5w
April 1, 2024
35601
High income
HIC
false
2
1
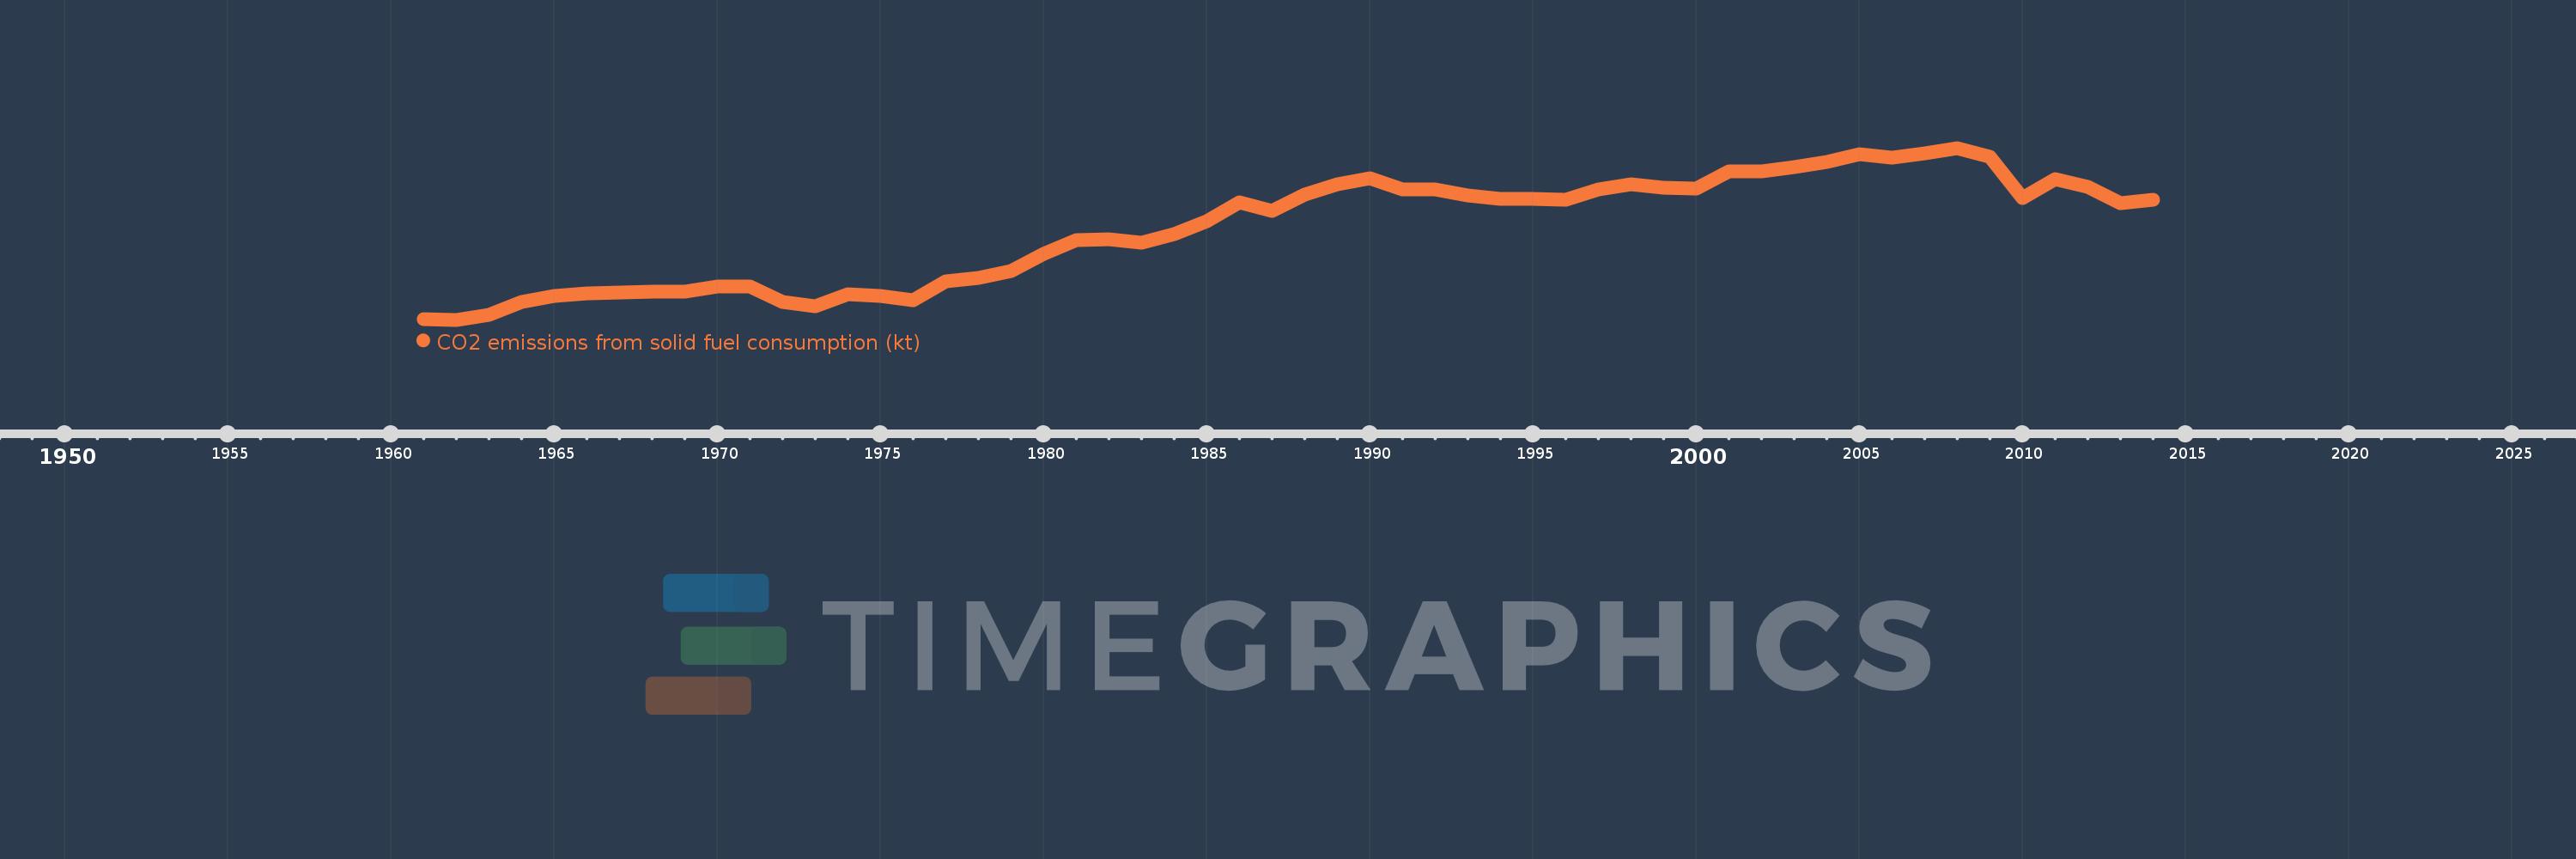
CO2 emissions from solid fuel consumption (kt)
2014,2013,2012,2011,2010,2009,2008,2007,2006,2005,2004,2003,2002,2001,2000,1999,1998,1997,1996,1995,1994,1993,1992,1991,1990,1989,1988,1987,1986,1985,1984,1983,1982,1981,1980,1979,1978,1977,1976,1975,1974,1973,1972,1971,1970,1969,1968,1967,1966,1965,1964,1963,1962,1961
This statistics in other country:
AfghanistanAlbaniaAlgeriaAndorraAngolaAntigua and BarbudaArgentinaArmeniaArubaAustraliaAustriaAzerbaijanBahamas, TheBahrainBangladeshBarbadosBelarusBelgiumBelizeBeninBermudaBhutanBoliviaBosnia and HerzegovinaBotswanaBrazilBritish Virgin IslandsBrunei DarussalamBulgariaBurkina FasoBurundiCabo VerdeCambodiaCameroonCanadaCayman IslandsCentral African RepublicCentral Europe and the BalticsChadChileChinaColombiaComorosCongo, Dem. Rep.Congo, Rep.Costa RicaCote d'IvoireCroatiaCubaCuracaoCyprusCzech RepublicDenmarkDjiboutiDominicaDominican RepublicEarly-demographic dividendEast Asia & PacificEast Asia & Pacific (excluding high income)East Asia & Pacific (IDA & IBRD countries)EcuadorEgypt, Arab Rep.El SalvadorEquatorial GuineaEritreaEstoniaEthiopiaEuro areaEurope & Central AsiaEurope & Central Asia (excluding high income)Europe & Central Asia (IDA & IBRD countries)European UnionFaroe IslandsFijiFinlandFranceFrench PolynesiaGabonGambia, TheGeorgiaGermanyGhanaGibraltarGreeceGreenlandGrenadaGuatemalaGuineaGuinea-BissauGuyanaHaitiHigh incomeHondurasHong Kong SAR, ChinaHungaryIBRD onlyIcelandIDA & IBRD totalIDA blendIDA totalIndiaIndonesiaIran, Islamic Rep.IraqIrelandIsraelItalyJamaicaJapanJordanKazakhstanKenyaKiribatiKorea, Dem. People’s Rep.Korea, Rep.KuwaitKyrgyz RepublicLao PDRLate-demographic dividendLatin America & Caribbean Latin America & Caribbean (excluding high income)Latin America & the Caribbean (IDA & IBRD countries)LatviaLebanonLesothoLiberiaLibyaLiechtensteinLithuaniaLow & middle incomeLower middle incomeLuxembourgMacao SAR, ChinaMacedonia, FYRMadagascarMalawiMalaysiaMaldivesMaliMaltaMarshall IslandsMauritaniaMauritiusMexicoMicronesia, Fed. Sts.Middle East & North Africa (excluding high income)Middle East & North Africa (IDA & IBRD countries)Middle incomeMoldovaMongoliaMontenegroMoroccoMozambiqueMyanmarNamibiaNauruNepalNetherlandsNew CaledoniaNew ZealandNicaraguaNigerNigeriaNorth AmericaNorwayOECD membersOmanPakistanPalauPanamaPapua New GuineaParaguayPeruPhilippinesPolandPortugalPost-demographic dividendQatarRomaniaRussian FederationRwandaSamoaSao Tome and PrincipeSaudi ArabiaSenegalSerbiaSeychellesSierra LeoneSingaporeSint Maarten (Dutch part)Slovak RepublicSloveniaSolomon IslandsSomaliaSouth AfricaSouth AsiaSouth Asia (IDA & IBRD)South SudanSpainSri LankaSt. Kitts and NevisSt. LuciaSt. Vincent and the GrenadinesSudanSurinameSwazilandSwedenSwitzerlandSyrian Arab RepublicTajikistanTanzaniaThailandTimor-LesteTogoTongaTrinidad and TobagoTunisiaTurkeyTurkmenistanTurks and Caicos IslandsUgandaUkraineUnited Arab EmiratesUnited KingdomUnited StatesUpper middle incomeUruguayUzbekistanVanuatuVenezuela, RBVietnamWest Bank and GazaWorldYemen, Rep.ZambiaZimbabwe Timeline:
This timeline shows a graph from 1961 to 2014 of High income. No data until 1960. Number of actual observations by date: 54.
Source name:
World Development Indicators
Source organization:
Carbon Dioxide Information Analysis Center, Environmental Sciences Division, Oak Ridge National Laboratory, Tennessee, United States.
Categories, topics:
Climate Change, Environment
Last updated:
apr 23, 2017
Indicators value changes by year
Minimum:
2.763 mln
jan 1, 1962
Maximum:
4.618 mln
jan 1, 2008
At the date of observation
Value
Absolute change
Change from previous value
jan 1, 1961
2.77 mln
+2.77 mln
0.0%
jan 1, 1962
2.763 mln
-6.872K
-0.25%
jan 1, 1963
2.819 mln
+56.011K
2.03%
jan 1, 1964
2.954 mln
+134.434K
4.77%
jan 1, 1965
3.016 mln
+62.182K
2.11%
jan 1, 1966
3.052 mln
+36.316K
1.2%
jan 1, 1967
3.061 mln
+8.215K
0.27%
jan 1, 1968
3.069 mln
+8.757K
0.29%
jan 1, 1969
3.071 mln
+1.273K
0.04%
jan 1, 1970
3.126 mln
+55.275K
1.8%
jan 1, 1971
3.119 mln
-7.299K
-0.23%
jan 1, 1972
2.955 mln
-163.975K
-5.26%
jan 1, 1973
2.913 mln
-41.32K
-1.4%
jan 1, 1974
3.039 mln
+125.832K
4.32%
jan 1, 1975
3.022 mln
-16.651K
-0.55%
jan 1, 1976
2.977 mln
-44.941K
-1.49%
jan 1, 1977
3.175 mln
+197.641K
6.64%
jan 1, 1978
3.217 mln
+41.668K
1.31%
jan 1, 1979
3.29 mln
+73.302K
2.28%
jan 1, 1980
3.472 mln
+182.069K
5.53%
jan 1, 1981
3.62 mln
+148.036K
4.26%
jan 1, 1982
3.631 mln
+10.836K
0.3%
jan 1, 1983
3.594 mln
-36.79K
-1.01%
jan 1, 1984
3.688 mln
+93.478K
2.6%
jan 1, 1985
3.823 mln
+135.031K
3.66%
jan 1, 1986
4.027 mln
+204.035K
5.34%
jan 1, 1987
3.942 mln
-85.066K
-2.11%
jan 1, 1988
4.111 mln
+169.581K
4.3%
jan 1, 1989
4.227 mln
+115.935K
2.82%
jan 1, 1990
4.289 mln
+61.593K
1.46%
jan 1, 1991
4.168 mln
-120.366K
-2.81%
jan 1, 1992
4.174 mln
+5.101K
0.12%
jan 1, 1993
4.103 mln
-70.564K
-1.69%
jan 1, 1994
4.071 mln
-32.208K
-0.78%
jan 1, 1995
4.066 mln
-4.473K
-0.11%
jan 1, 1996
4.062 mln
-4.368K
-0.11%
jan 1, 1997
4.169 mln
+106.762K
2.63%
jan 1, 1998
4.221 mln
+52.272K
1.25%
jan 1, 1999
4.193 mln
-27.887K
-0.66%
jan 1, 2000
4.176 mln
-17.263K
-0.41%
jan 1, 2001
4.367 mln
+191.431K
4.58%
jan 1, 2002
4.366 mln
-990.722
-0.02%
jan 1, 2003
4.408 mln
+41.613K
0.95%
jan 1, 2004
4.463 mln
+54.868K
1.24%
jan 1, 2005
4.554 mln
+91.647K
2.05%
jan 1, 2006
4.516 mln
-38.01K
-0.83%
jan 1, 2007
4.563 mln
+46.968K
1.04%
jan 1, 2008
4.618 mln
+54.469K
1.19%
jan 1, 2009
4.524 mln
-93.531K
-2.03%
jan 1, 2010
4.076 mln
-448.71K
-9.92%
jan 1, 2011
4.285 mln
+209.855K
5.15%
jan 1, 2012
4.197 mln
-88.603K
-2.07%
jan 1, 2013
4.018 mln
-178.563K
-4.25%
jan 1, 2014
4.059 mln
+40.743K
1.01%
Ranking of countries by current statistics by years


Comments: