29
/
en
AIzaSyAYiBZKx7MnpbEhh9jyipgxe19OcubqV5w
April 1, 2024
38006
IDA blend
IDB
false
2
1
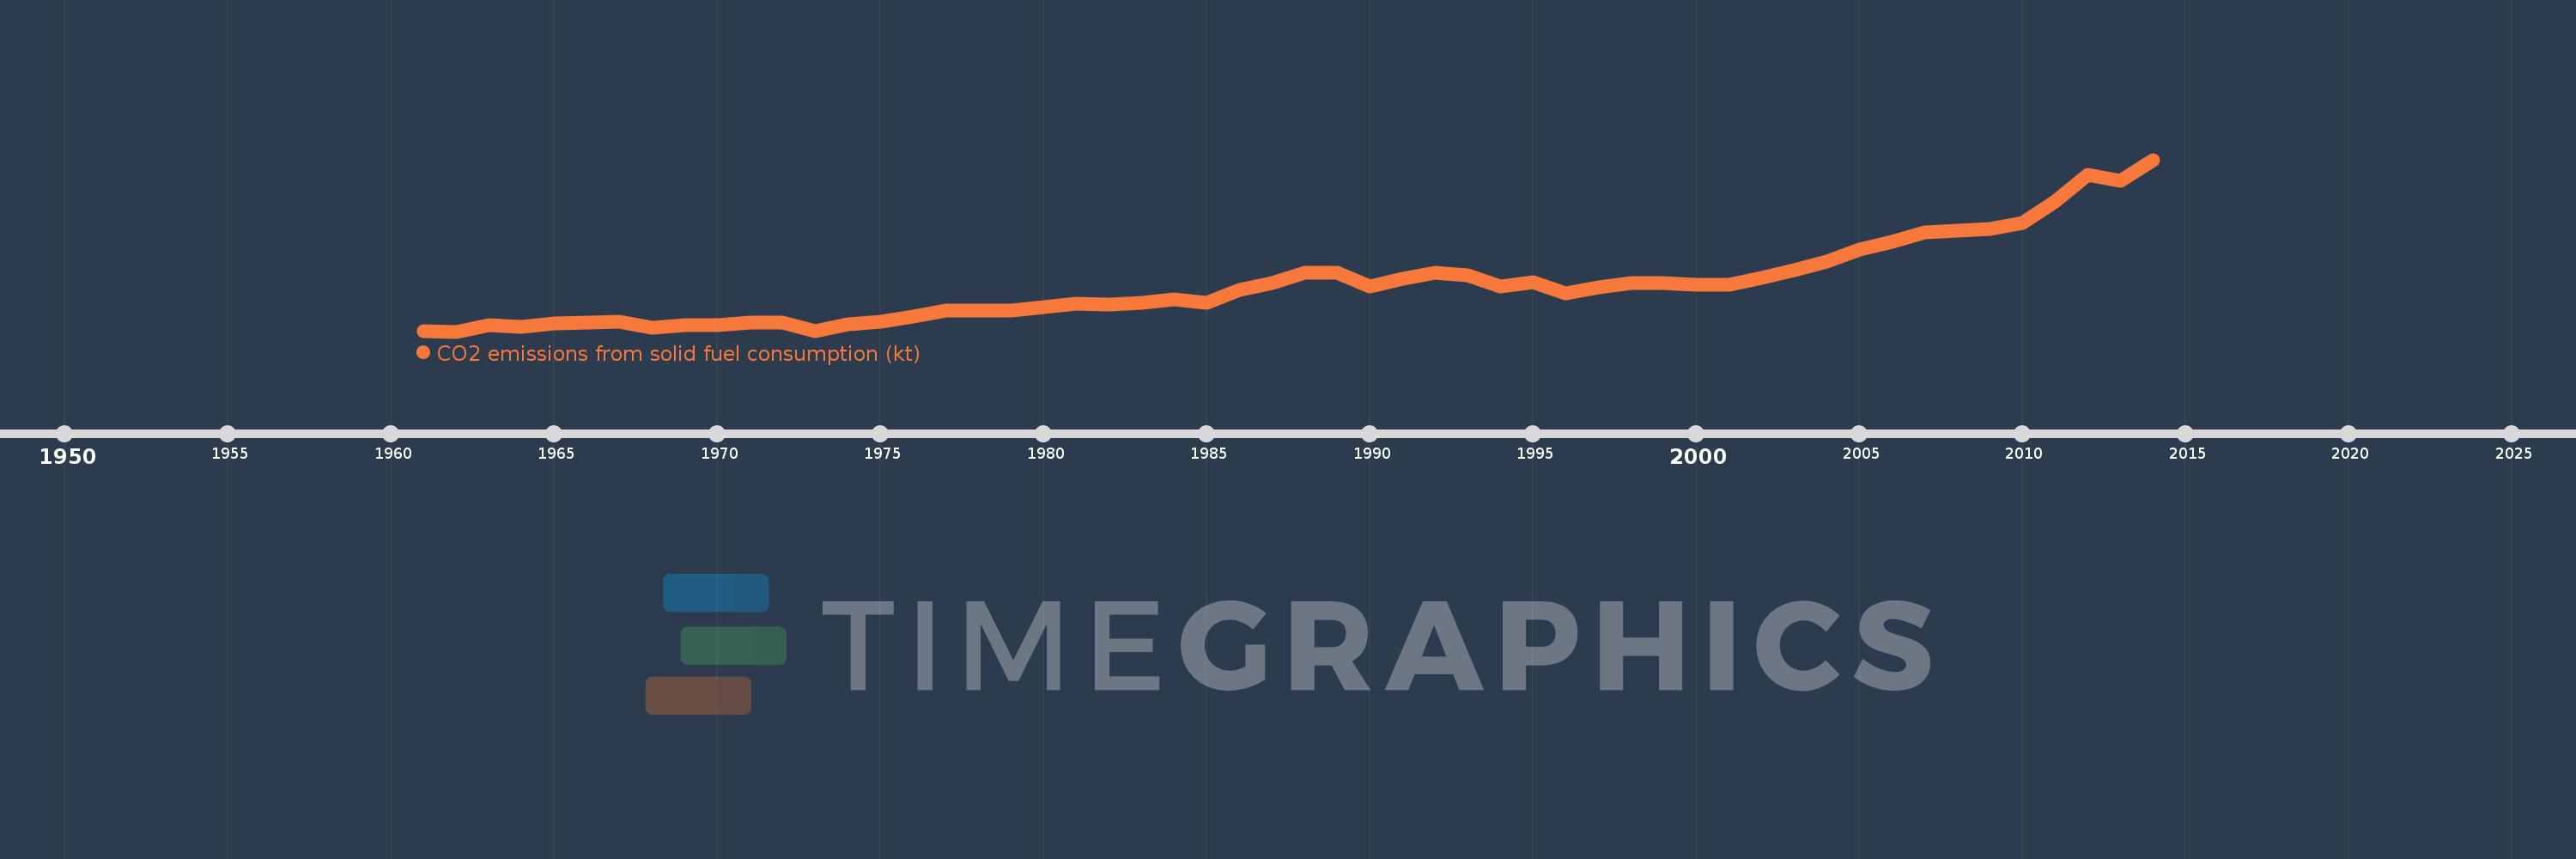
CO2 emissions from solid fuel consumption (kt)
2014,2013,2012,2011,2010,2009,2008,2007,2006,2005,2004,2003,2002,2001,2000,1999,1998,1997,1996,1995,1994,1993,1992,1991,1990,1989,1988,1987,1986,1985,1984,1983,1982,1981,1980,1979,1978,1977,1976,1975,1974,1973,1972,1971,1970,1969,1968,1967,1966,1965,1964,1963,1962,1961
This statistics in other country:
AfghanistanAlbaniaAlgeriaAndorraAngolaAntigua and BarbudaArgentinaArmeniaArubaAustraliaAustriaAzerbaijanBahamas, TheBahrainBangladeshBarbadosBelarusBelgiumBelizeBeninBermudaBhutanBoliviaBosnia and HerzegovinaBotswanaBrazilBritish Virgin IslandsBrunei DarussalamBulgariaBurkina FasoBurundiCabo VerdeCambodiaCameroonCanadaCayman IslandsCentral African RepublicCentral Europe and the BalticsChadChileChinaColombiaComorosCongo, Dem. Rep.Congo, Rep.Costa RicaCote d'IvoireCroatiaCubaCuracaoCyprusCzech RepublicDenmarkDjiboutiDominicaDominican RepublicEarly-demographic dividendEast Asia & PacificEast Asia & Pacific (excluding high income)East Asia & Pacific (IDA & IBRD countries)EcuadorEgypt, Arab Rep.El SalvadorEquatorial GuineaEritreaEstoniaEthiopiaEuro areaEurope & Central AsiaEurope & Central Asia (excluding high income)Europe & Central Asia (IDA & IBRD countries)European UnionFaroe IslandsFijiFinlandFranceFrench PolynesiaGabonGambia, TheGeorgiaGermanyGhanaGibraltarGreeceGreenlandGrenadaGuatemalaGuineaGuinea-BissauGuyanaHaitiHigh incomeHondurasHong Kong SAR, ChinaHungaryIBRD onlyIcelandIDA & IBRD totalIDA blendIDA totalIndiaIndonesiaIran, Islamic Rep.IraqIrelandIsraelItalyJamaicaJapanJordanKazakhstanKenyaKiribatiKorea, Dem. People’s Rep.Korea, Rep.KuwaitKyrgyz RepublicLao PDRLate-demographic dividendLatin America & Caribbean Latin America & Caribbean (excluding high income)Latin America & the Caribbean (IDA & IBRD countries)LatviaLebanonLesothoLiberiaLibyaLiechtensteinLithuaniaLow & middle incomeLower middle incomeLuxembourgMacao SAR, ChinaMacedonia, FYRMadagascarMalawiMalaysiaMaldivesMaliMaltaMarshall IslandsMauritaniaMauritiusMexicoMicronesia, Fed. Sts.Middle East & North Africa (excluding high income)Middle East & North Africa (IDA & IBRD countries)Middle incomeMoldovaMongoliaMontenegroMoroccoMozambiqueMyanmarNamibiaNauruNepalNetherlandsNew CaledoniaNew ZealandNicaraguaNigerNigeriaNorth AmericaNorwayOECD membersOmanPakistanPalauPanamaPapua New GuineaParaguayPeruPhilippinesPolandPortugalPost-demographic dividendQatarRomaniaRussian FederationRwandaSamoaSao Tome and PrincipeSaudi ArabiaSenegalSerbiaSeychellesSierra LeoneSingaporeSint Maarten (Dutch part)Slovak RepublicSloveniaSolomon IslandsSomaliaSouth AfricaSouth AsiaSouth Asia (IDA & IBRD)South SudanSpainSri LankaSt. Kitts and NevisSt. LuciaSt. Vincent and the GrenadinesSudanSurinameSwazilandSwedenSwitzerlandSyrian Arab RepublicTajikistanTanzaniaThailandTimor-LesteTogoTongaTrinidad and TobagoTunisiaTurkeyTurkmenistanTurks and Caicos IslandsUgandaUkraineUnited Arab EmiratesUnited KingdomUnited StatesUpper middle incomeUruguayUzbekistanVanuatuVenezuela, RBVietnamWest Bank and GazaWorldYemen, Rep.ZambiaZimbabwe Timeline:
This timeline shows a graph from 1961 to 2014 of IDA blend. No data until 1960. Number of actual observations by date: 54.
Source name:
World Development Indicators
Source organization:
Carbon Dioxide Information Analysis Center, Environmental Sciences Division, Oak Ridge National Laboratory, Tennessee, United States.
Categories, topics:
Climate Change, Environment
Last updated:
apr 23, 2017
Indicators value changes by year
Minimum:
24.759K
jan 1, 1962
Maximum:
138.064K
jan 1, 2014
At the date of observation
Value
Absolute change
Change from previous value
jan 1, 1961
24.848K
+24.848K
0.0%
jan 1, 1962
24.759K
-88.992
-0.36%
jan 1, 1963
28.993K
+4.235K
17.1%
jan 1, 1964
28.122K
-871.071
-3.0%
jan 1, 1965
30.17K
+2.047K
7.28%
jan 1, 1966
30.573K
+403.049
1.34%
jan 1, 1967
31.545K
+972.692
3.18%
jan 1, 1968
27.546K
-3.999K
-12.68%
jan 1, 1969
28.863K
+1.317K
4.78%
jan 1, 1970
28.836K
-26.864
-0.09%
jan 1, 1971
30.695K
+1.859K
6.45%
jan 1, 1972
30.443K
-252.524
-0.82%
jan 1, 1973
24.961K
-5.481K
-18.01%
jan 1, 1974
29.524K
+4.562K
18.28%
jan 1, 1975
31.055K
+1.532K
5.19%
jan 1, 1976
34.924K
+3.869K
12.46%
jan 1, 1977
38.359K
+3.434K
9.83%
jan 1, 1978
38.821K
+462.218
1.2%
jan 1, 1979
38.816K
-5.375
-0.01%
jan 1, 1980
40.922K
+2.107K
5.43%
jan 1, 1981
43.013K
+2.09K
5.11%
jan 1, 1982
42.422K
-591.132
-1.37%
jan 1, 1983
43.991K
+1.569K
3.7%
jan 1, 1984
45.957K
+1.967K
4.47%
jan 1, 1985
43.915K
-2.042K
-4.44%
jan 1, 1986
52.293K
+8.378K
19.08%
jan 1, 1987
56.56K
+4.266K
8.16%
jan 1, 1988
63.658K
+7.099K
12.55%
jan 1, 1989
63.481K
-177.337
-0.28%
jan 1, 1990
54.604K
-8.878K
-13.98%
jan 1, 1991
59.402K
+4.798K
8.79%
jan 1, 1992
63.545K
+4.143K
6.97%
jan 1, 1993
61.976K
-1.569K
-2.47%
jan 1, 1994
54.274K
-7.702K
-12.43%
jan 1, 1995
57.597K
+3.323K
6.12%
jan 1, 1996
50.025K
-7.572K
-13.15%
jan 1, 1997
53.738K
+3.713K
7.42%
jan 1, 1998
56.522K
+2.784K
5.18%
jan 1, 1999
56.607K
+85.221
0.15%
jan 1, 2000
55.43K
-1.177K
-2.08%
jan 1, 2001
55.889K
+458.604
0.83%
jan 1, 2002
60.045K
+4.156K
7.44%
jan 1, 2003
65.248K
+5.203K
8.67%
jan 1, 2004
71.161K
+5.913K
9.06%
jan 1, 2005
78.701K
+7.541K
10.6%
jan 1, 2006
84.071K
+5.369K
6.82%
jan 1, 2007
90.093K
+6.023K
7.16%
jan 1, 2008
91.246K
+1.153K
1.28%
jan 1, 2009
92.382K
+1.136K
1.25%
jan 1, 2010
96.282K
+3.9K
4.22%
jan 1, 2011
110.475K
+14.192K
14.74%
jan 1, 2012
128.34K
+17.865K
16.17%
jan 1, 2013
124.196K
-4.144K
-3.23%
jan 1, 2014
138.064K
+13.868K
11.17%
Ranking of countries by current statistics by years


Comments: