29
/
en
AIzaSyAYiBZKx7MnpbEhh9jyipgxe19OcubqV5w
April 1, 2024
83844
Benin
BEN
true
2
1
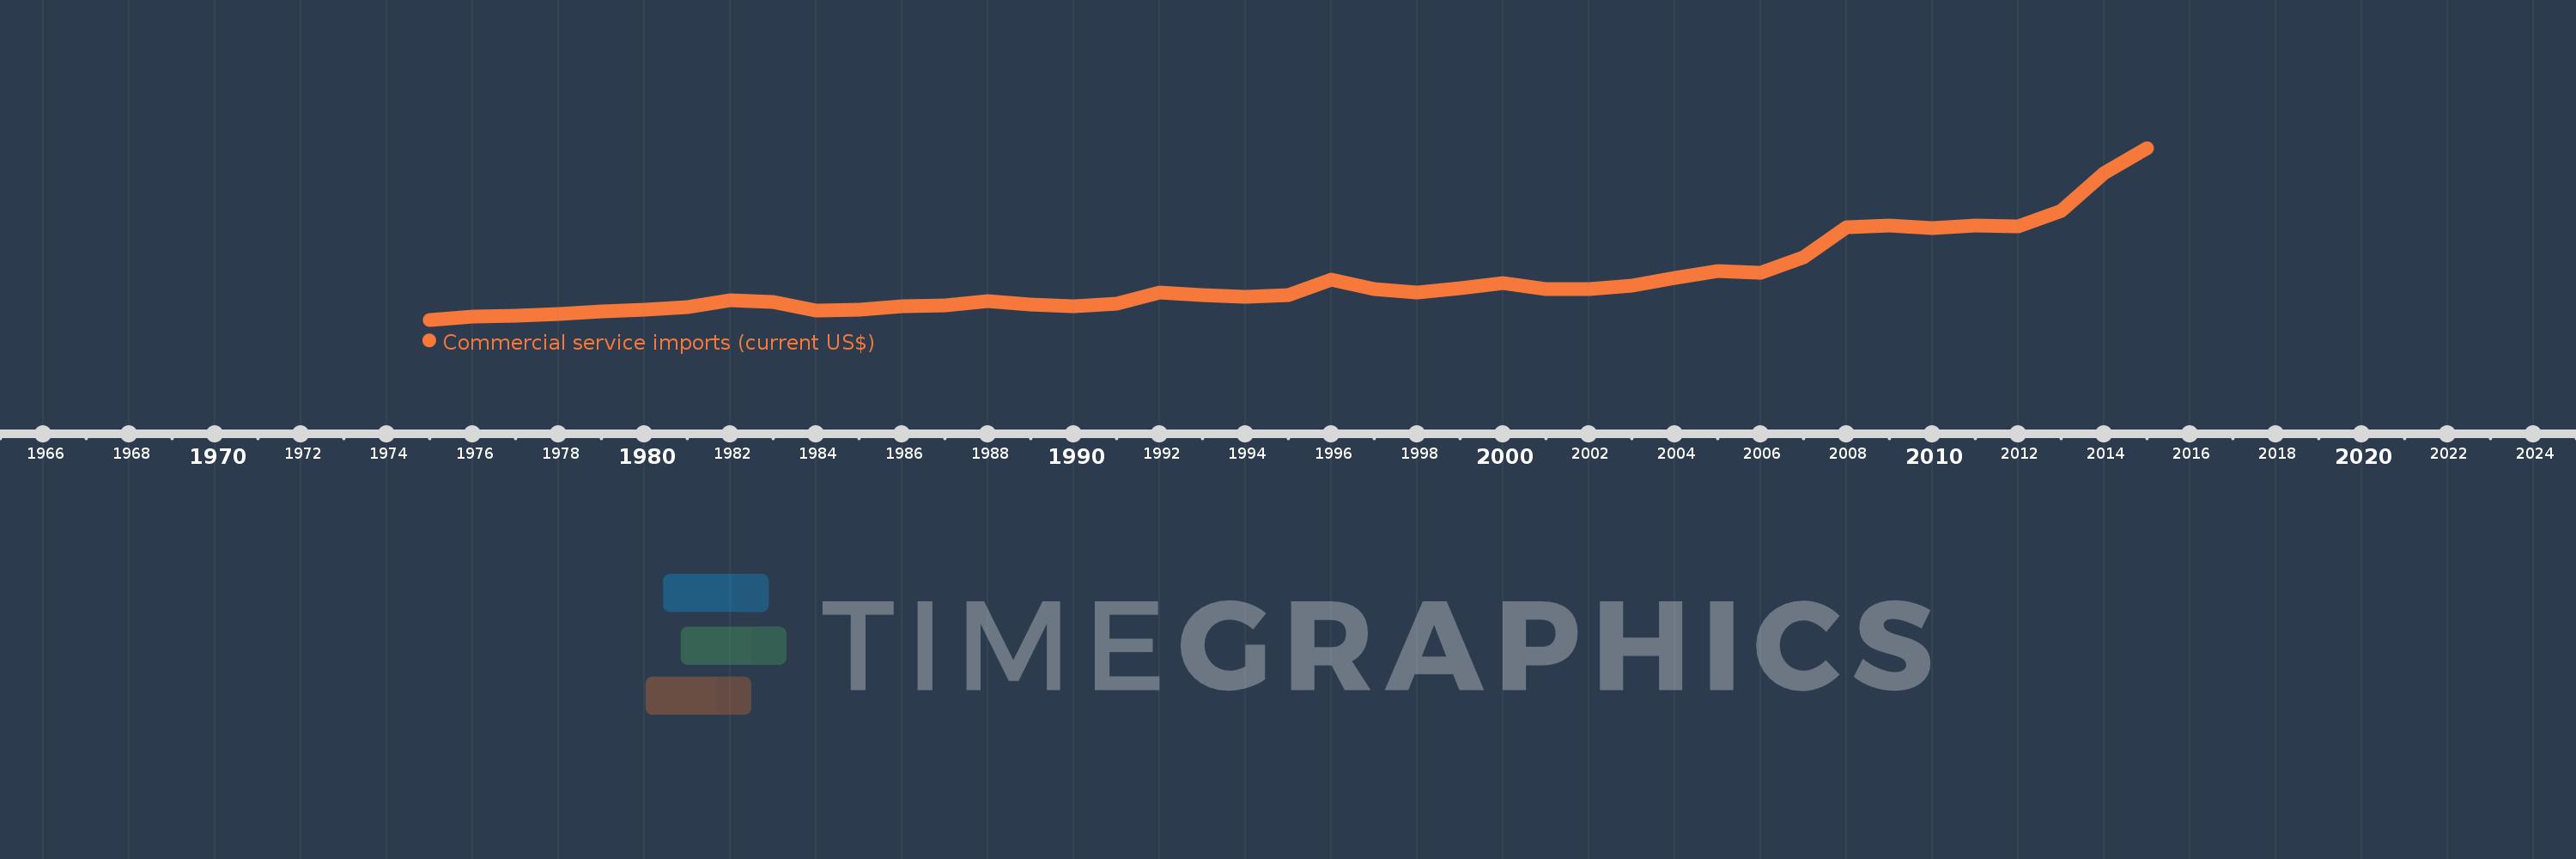
Commercial service imports (current US$)
2015,2014,2013,2012,2011,2010,2009,2008,2007,2006,2005,2004,2003,2002,2001,2000,1999,1998,1997,1996,1995,1994,1993,1992,1991,1990,1989,1988,1987,1986,1985,1984,1983,1982,1981,1980,1979,1978,1977,1976,1975
This statistics in other country:
AfghanistanAlbaniaAlgeriaAngolaAntigua and BarbudaArab WorldArgentinaArmeniaArubaAustraliaAustriaAzerbaijanBahamas, TheBahrainBangladeshBarbadosBelarusBelgiumBelizeBeninBermudaBhutanBoliviaBosnia and HerzegovinaBotswanaBrazilBrunei DarussalamBulgariaBurkina FasoBurundiCabo VerdeCambodiaCameroonCanadaCaribbean small statesCentral African RepublicCentral Europe and the BalticsChadChileChinaColombiaComorosCongo, Dem. Rep.Congo, Rep.Costa RicaCote d'IvoireCroatiaCuracaoCyprusCzech RepublicDenmarkDjiboutiDominicaDominican RepublicEarly-demographic dividendEast Asia & PacificEast Asia & Pacific (excluding high income)East Asia & Pacific (IDA & IBRD countries)EcuadorEgypt, Arab Rep.El SalvadorEquatorial GuineaEritreaEstoniaEthiopiaEuro areaEurope & Central AsiaEurope & Central Asia (excluding high income)Europe & Central Asia (IDA & IBRD countries)European UnionFaroe IslandsFijiFinlandFragile and conflict affected situationsFranceFrench PolynesiaGabonGambia, TheGeorgiaGermanyGhanaGreeceGrenadaGuatemalaGuineaGuinea-BissauGuyanaHaitiHeavily indebted poor countries (HIPC)High incomeHondurasHong Kong SAR, ChinaHungaryIBRD onlyIcelandIDA & IBRD totalIDA blendIDA onlyIDA totalIndiaIndonesiaIran, Islamic Rep.IraqIrelandIsraelItalyJamaicaJapanJordanKazakhstanKenyaKiribatiKorea, Rep.KosovoKuwaitKyrgyz RepublicLao PDRLate-demographic dividendLatin America & Caribbean Latin America & Caribbean (excluding high income)Latin America & the Caribbean (IDA & IBRD countries)LatviaLeast developed countries: UN classificationLebanonLesothoLiberiaLibyaLithuaniaLow & middle incomeLow incomeLower middle incomeLuxembourgMacao SAR, ChinaMacedonia, FYRMadagascarMalawiMalaysiaMaldivesMaliMaltaMarshall IslandsMauritaniaMauritiusMexicoMicronesia, Fed. Sts.Middle East & North Africa (excluding high income)Middle East & North Africa (IDA & IBRD countries)Middle incomeMoldovaMongoliaMontenegroMoroccoMozambiqueMyanmarNamibiaNepalNetherlandsNew CaledoniaNew ZealandNicaraguaNigerNigeriaNorth AmericaNorwayOECD membersOmanOther small statesPacific island small statesPakistanPalauPanamaPapua New GuineaParaguayPeruPhilippinesPolandPortugalPost-demographic dividendPre-demographic dividendQatarRomaniaRussian FederationRwandaSamoaSao Tome and PrincipeSaudi ArabiaSenegalSerbiaSeychellesSierra LeoneSingaporeSint Maarten (Dutch part)Slovak RepublicSloveniaSmall statesSolomon IslandsSouth AfricaSouth AsiaSouth Asia (IDA & IBRD)South SudanSpainSri LankaSt. Kitts and NevisSt. LuciaSt. Vincent and the GrenadinesSub-Saharan Africa Sub-Saharan Africa (excluding high income)Sub-Saharan Africa (IDA & IBRD countries)SudanSurinameSwazilandSwedenSwitzerlandSyrian Arab RepublicTajikistanTanzaniaThailandTimor-LesteTogoTongaTrinidad and TobagoTunisiaTurkeyTuvaluUgandaUkraineUnited KingdomUnited StatesUpper middle incomeUruguayVanuatuVenezuela, RBVietnamWest Bank and GazaWorldYemen, Rep.ZambiaZimbabwe Timeline:
This timeline shows a graph from 1975 to 2015 of Benin. No data until 1974. Number of actual observations by date: 41.
Source name:
World Development Indicators
Source organization:
International Monetary Fund, Balance of Payments Statistics Yearbook and data files.
Categories, topics:
Private Sector, Trade
Last updated:
apr 23, 2017
Indicators value changes by year
Minimum:
35.899 mln
jan 1, 1975
Maximum:
883.757 mln
jan 1, 2015
At the date of observation
Value
Absolute change
Change from previous value
jan 1, 1975
35.899 mln
+35.899 mln
0.0%
jan 1, 1976
52.61 mln
+16.711 mln
46.55%
jan 1, 1977
55.116 mln
+2.506 mln
4.76%
jan 1, 1978
65.573 mln
+10.457 mln
18.97%
jan 1, 1979
75.54 mln
+9.967 mln
15.2%
jan 1, 1980
86.037 mln
+10.498 mln
13.9%
jan 1, 1981
97.364 mln
+11.327 mln
13.16%
jan 1, 1982
132.546 mln
+35.182 mln
36.13%
jan 1, 1983
123.719 mln
-8.827 mln
-6.66%
jan 1, 1984
82.686 mln
-41.033 mln
-33.17%
jan 1, 1985
83.429 mln
+742.87K
0.9%
jan 1, 1986
102.39 mln
+18.961 mln
22.73%
jan 1, 1987
107.708 mln
+5.318 mln
5.19%
jan 1, 1988
126.108 mln
+18.4 mln
17.08%
jan 1, 1989
110.819 mln
-15.289 mln
-12.12%
jan 1, 1990
103.508 mln
-7.311 mln
-6.6%
jan 1, 1991
113.413 mln
+9.905 mln
9.57%
jan 1, 1992
169.361 mln
+55.948 mln
49.33%
jan 1, 1993
156.732 mln
-12.629 mln
-7.46%
jan 1, 1994
149.247 mln
-7.485 mln
-4.78%
jan 1, 1995
155.471 mln
+6.224 mln
4.17%
jan 1, 1996
235.181 mln
+79.71 mln
51.27%
jan 1, 1997
185.832 mln
-49.348 mln
-20.98%
jan 1, 1998
170.091 mln
-15.741 mln
-8.47%
jan 1, 1999
191.585 mln
+21.494 mln
12.64%
jan 1, 2000
215.842 mln
+24.257 mln
12.66%
jan 1, 2001
187.642 mln
-28.2 mln
-13.07%
jan 1, 2002
185.792 mln
-1.85 mln
-0.99%
jan 1, 2003
203.975 mln
+18.182 mln
9.79%
jan 1, 2004
244.024 mln
+40.05 mln
19.63%
jan 1, 2005
275.738 mln
+31.713 mln
13.0%
jan 1, 2006
269.298 mln
-6.44 mln
-2.34%
jan 1, 2007
345.958 mln
+76.66 mln
28.47%
jan 1, 2008
491.255 mln
+145.297 mln
42.0%
jan 1, 2009
500.01 mln
+8.755 mln
1.78%
jan 1, 2010
488.174 mln
-11.836 mln
-2.37%
jan 1, 2011
502.878 mln
+14.704 mln
3.01%
jan 1, 2012
496.523 mln
-6.355 mln
-1.26%
jan 1, 2013
575.054 mln
+78.531 mln
15.82%
jan 1, 2014
760.843 mln
+185.789 mln
32.31%
jan 1, 2015
883.757 mln
+122.915 mln
16.16%
Ranking of countries by current statistics by years


Comments: