29
/
en
AIzaSyAYiBZKx7MnpbEhh9jyipgxe19OcubqV5w
April 1, 2024
124586
Egypt, Arab Rep.
EGY
true
2
1
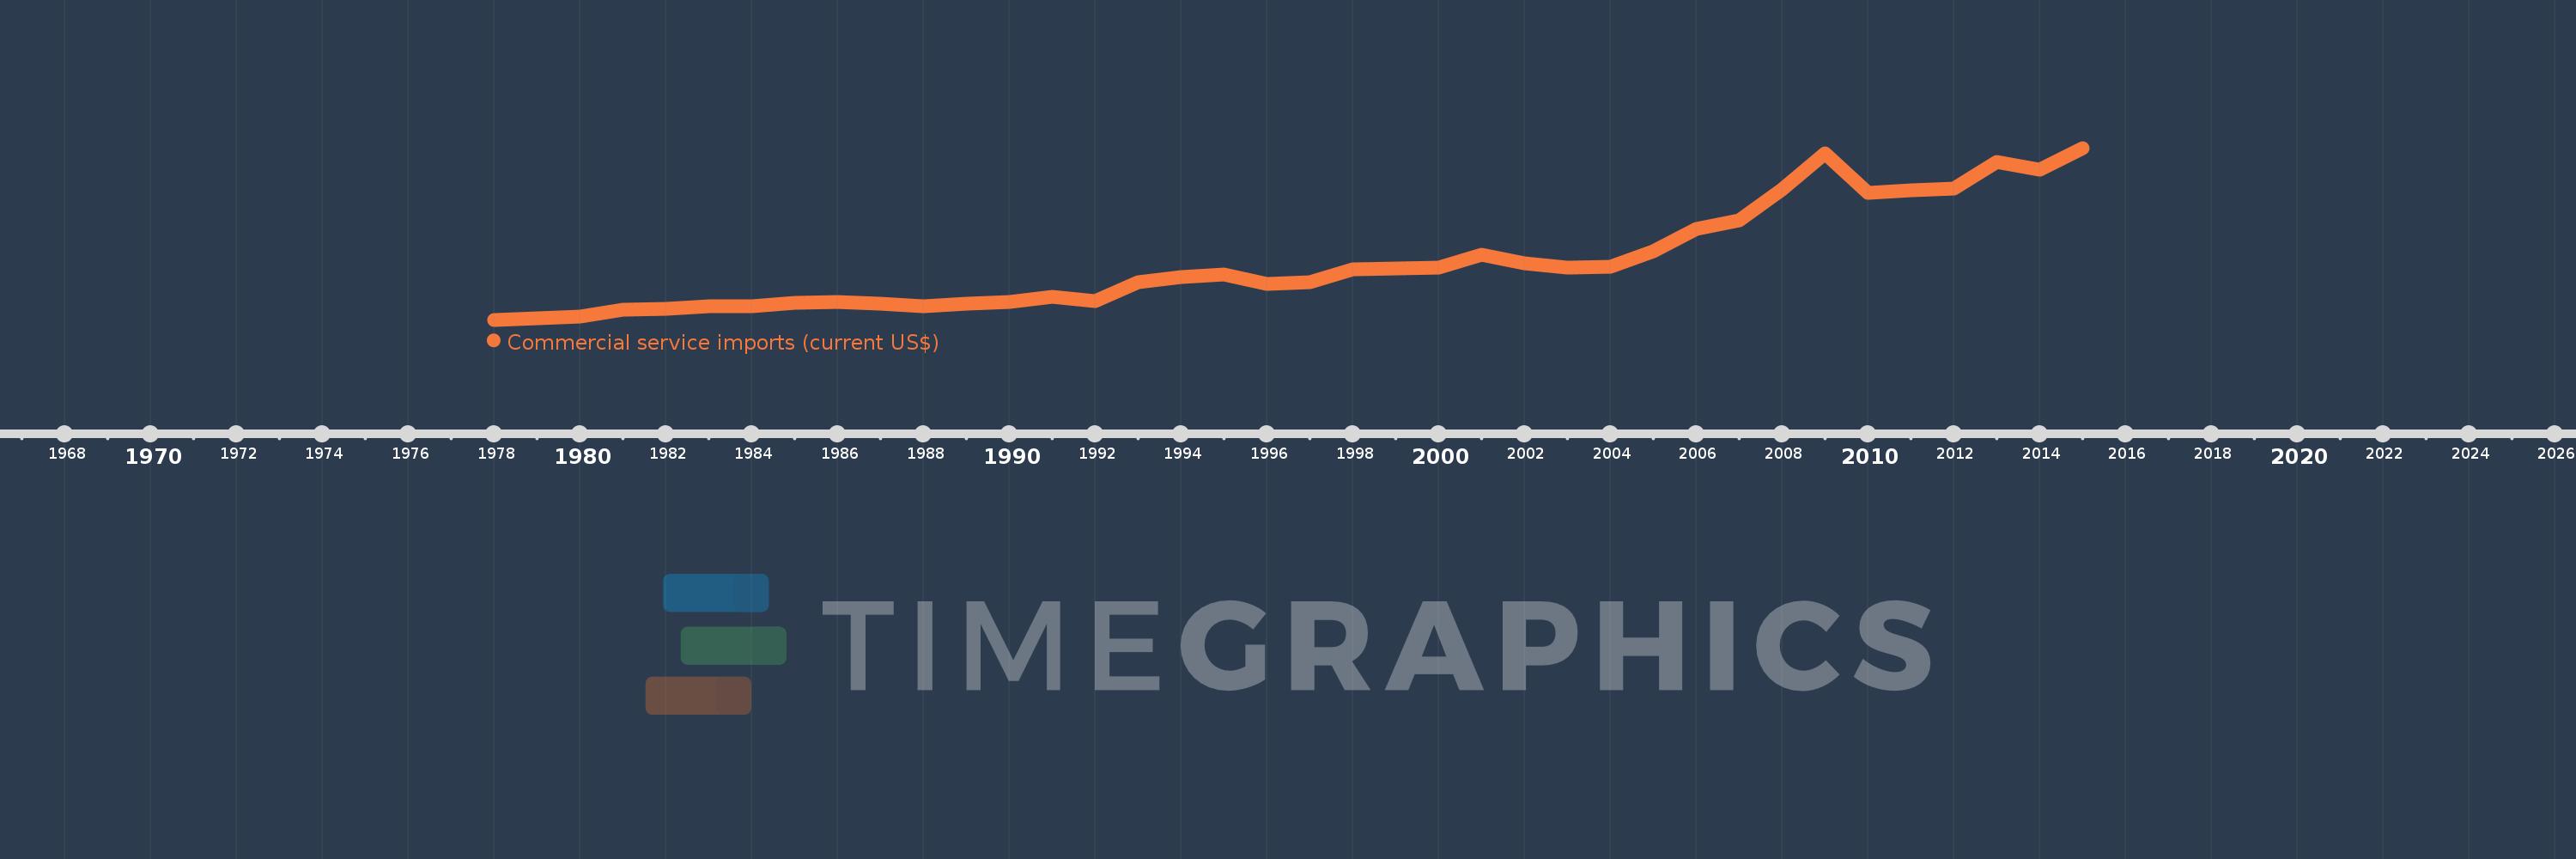
Commercial service imports (current US$)
2015,2014,2013,2012,2011,2010,2009,2008,2007,2006,2005,2004,2003,2002,2001,2000,1999,1998,1997,1996,1995,1994,1993,1992,1991,1990,1989,1988,1987,1986,1985,1984,1983,1982,1981,1980,1979,1978
This statistics in other country:
AfghanistanAlbaniaAlgeriaAngolaAntigua and BarbudaArab WorldArgentinaArmeniaArubaAustraliaAustriaAzerbaijanBahamas, TheBahrainBangladeshBarbadosBelarusBelgiumBelizeBeninBermudaBhutanBoliviaBosnia and HerzegovinaBotswanaBrazilBrunei DarussalamBulgariaBurkina FasoBurundiCabo VerdeCambodiaCameroonCanadaCaribbean small statesCentral African RepublicCentral Europe and the BalticsChadChileChinaColombiaComorosCongo, Dem. Rep.Congo, Rep.Costa RicaCote d'IvoireCroatiaCuracaoCyprusCzech RepublicDenmarkDjiboutiDominicaDominican RepublicEarly-demographic dividendEast Asia & PacificEast Asia & Pacific (excluding high income)East Asia & Pacific (IDA & IBRD countries)EcuadorEgypt, Arab Rep.El SalvadorEquatorial GuineaEritreaEstoniaEthiopiaEuro areaEurope & Central AsiaEurope & Central Asia (excluding high income)Europe & Central Asia (IDA & IBRD countries)European UnionFaroe IslandsFijiFinlandFragile and conflict affected situationsFranceFrench PolynesiaGabonGambia, TheGeorgiaGermanyGhanaGreeceGrenadaGuatemalaGuineaGuinea-BissauGuyanaHaitiHeavily indebted poor countries (HIPC)High incomeHondurasHong Kong SAR, ChinaHungaryIBRD onlyIcelandIDA & IBRD totalIDA blendIDA onlyIDA totalIndiaIndonesiaIran, Islamic Rep.IraqIrelandIsraelItalyJamaicaJapanJordanKazakhstanKenyaKiribatiKorea, Rep.KosovoKuwaitKyrgyz RepublicLao PDRLate-demographic dividendLatin America & Caribbean Latin America & Caribbean (excluding high income)Latin America & the Caribbean (IDA & IBRD countries)LatviaLeast developed countries: UN classificationLebanonLesothoLiberiaLibyaLithuaniaLow & middle incomeLow incomeLower middle incomeLuxembourgMacao SAR, ChinaMacedonia, FYRMadagascarMalawiMalaysiaMaldivesMaliMaltaMarshall IslandsMauritaniaMauritiusMexicoMicronesia, Fed. Sts.Middle East & North Africa (excluding high income)Middle East & North Africa (IDA & IBRD countries)Middle incomeMoldovaMongoliaMontenegroMoroccoMozambiqueMyanmarNamibiaNepalNetherlandsNew CaledoniaNew ZealandNicaraguaNigerNigeriaNorth AmericaNorwayOECD membersOmanOther small statesPacific island small statesPakistanPalauPanamaPapua New GuineaParaguayPeruPhilippinesPolandPortugalPost-demographic dividendPre-demographic dividendQatarRomaniaRussian FederationRwandaSamoaSao Tome and PrincipeSaudi ArabiaSenegalSerbiaSeychellesSierra LeoneSingaporeSint Maarten (Dutch part)Slovak RepublicSloveniaSmall statesSolomon IslandsSouth AfricaSouth AsiaSouth Asia (IDA & IBRD)South SudanSpainSri LankaSt. Kitts and NevisSt. LuciaSt. Vincent and the GrenadinesSub-Saharan Africa Sub-Saharan Africa (excluding high income)Sub-Saharan Africa (IDA & IBRD countries)SudanSurinameSwazilandSwedenSwitzerlandSyrian Arab RepublicTajikistanTanzaniaThailandTimor-LesteTogoTongaTrinidad and TobagoTunisiaTurkeyTuvaluUgandaUkraineUnited KingdomUnited StatesUpper middle incomeUruguayVanuatuVenezuela, RBVietnamWest Bank and GazaWorldYemen, Rep.ZambiaZimbabwe Timeline:
This timeline shows a graph from 1978 to 2015 of Egypt, Arab Rep.. No data until 1977. Number of actual observations by date: 38.
Source name:
World Development Indicators
Source organization:
International Monetary Fund, Balance of Payments Statistics Yearbook and data files.
Categories, topics:
Private Sector, Trade
Last updated:
apr 23, 2017
Indicators value changes by year
Minimum:
1.286 bln
jan 1, 1978
Maximum:
16.8 bln
jan 1, 2015
At the date of observation
Value
Absolute change
Change from previous value
jan 1, 1978
1.286 bln
+1.286 bln
0.0%
jan 1, 1979
1.397 bln
+110.655 mln
8.6%
jan 1, 1980
1.589 bln
+192.534 mln
13.79%
jan 1, 1981
2.186 bln
+596.714 mln
37.55%
jan 1, 1982
2.269 bln
+83.429 mln
3.82%
jan 1, 1983
2.514 bln
+244.857 mln
10.79%
jan 1, 1984
2.509 bln
-5.143 mln
-0.2%
jan 1, 1985
2.838 bln
+329.0 mln
13.11%
jan 1, 1986
2.855 bln
+16.714 mln
0.59%
jan 1, 1987
2.738 bln
-117.0 mln
-4.1%
jan 1, 1988
2.488 bln
-249.714 mln
-9.12%
jan 1, 1989
2.757 bln
+269.0 mln
10.81%
jan 1, 1990
2.856 bln
+99.364 mln
3.6%
jan 1, 1991
3.326 bln
+470.136 mln
16.46%
jan 1, 1992
2.998 bln
-328.5 mln
-9.88%
jan 1, 1993
4.646 bln
+1.648 bln
54.97%
jan 1, 1994
5.164 bln
+518.0 mln
11.15%
jan 1, 1995
5.382 bln
+218.0 mln
4.22%
jan 1, 1996
4.511 bln
-871.0 mln
-16.18%
jan 1, 1997
4.709 bln
+198.0 mln
4.39%
jan 1, 1998
5.813 bln
+1.104 bln
23.44%
jan 1, 1999
5.886 bln
+73.2 mln
1.26%
jan 1, 2000
5.959 bln
+72.7 mln
1.24%
jan 1, 2001
7.161 bln
+1.202 bln
20.18%
jan 1, 2002
6.356 bln
-804.7 mln
-11.24%
jan 1, 2003
6.013 bln
-343.125 mln
-5.4%
jan 1, 2004
6.038 bln
+24.762 mln
0.41%
jan 1, 2005
7.47 bln
+1.432 bln
23.72%
jan 1, 2006
9.507 bln
+2.037 bln
27.27%
jan 1, 2007
10.288 bln
+780.8 mln
8.21%
jan 1, 2008
13.088 bln
+2.8 bln
27.21%
jan 1, 2009
16.335 bln
+3.247 bln
24.81%
jan 1, 2010
12.765 bln
-3.57 bln
-21.85%
jan 1, 2011
12.991 bln
+225.8 mln
1.77%
jan 1, 2012
13.129 bln
+138.1 mln
1.06%
jan 1, 2013
15.557 bln
+2.428 bln
18.49%
jan 1, 2014
14.808 bln
-749.2 mln
-4.82%
jan 1, 2015
16.8 bln
+1.992 bln
13.45%
Ranking of countries by current statistics by years


Comments: