29
/
en
AIzaSyAYiBZKx7MnpbEhh9jyipgxe19OcubqV5w
April 1, 2024
73732
Austria
AUT
true
2
1
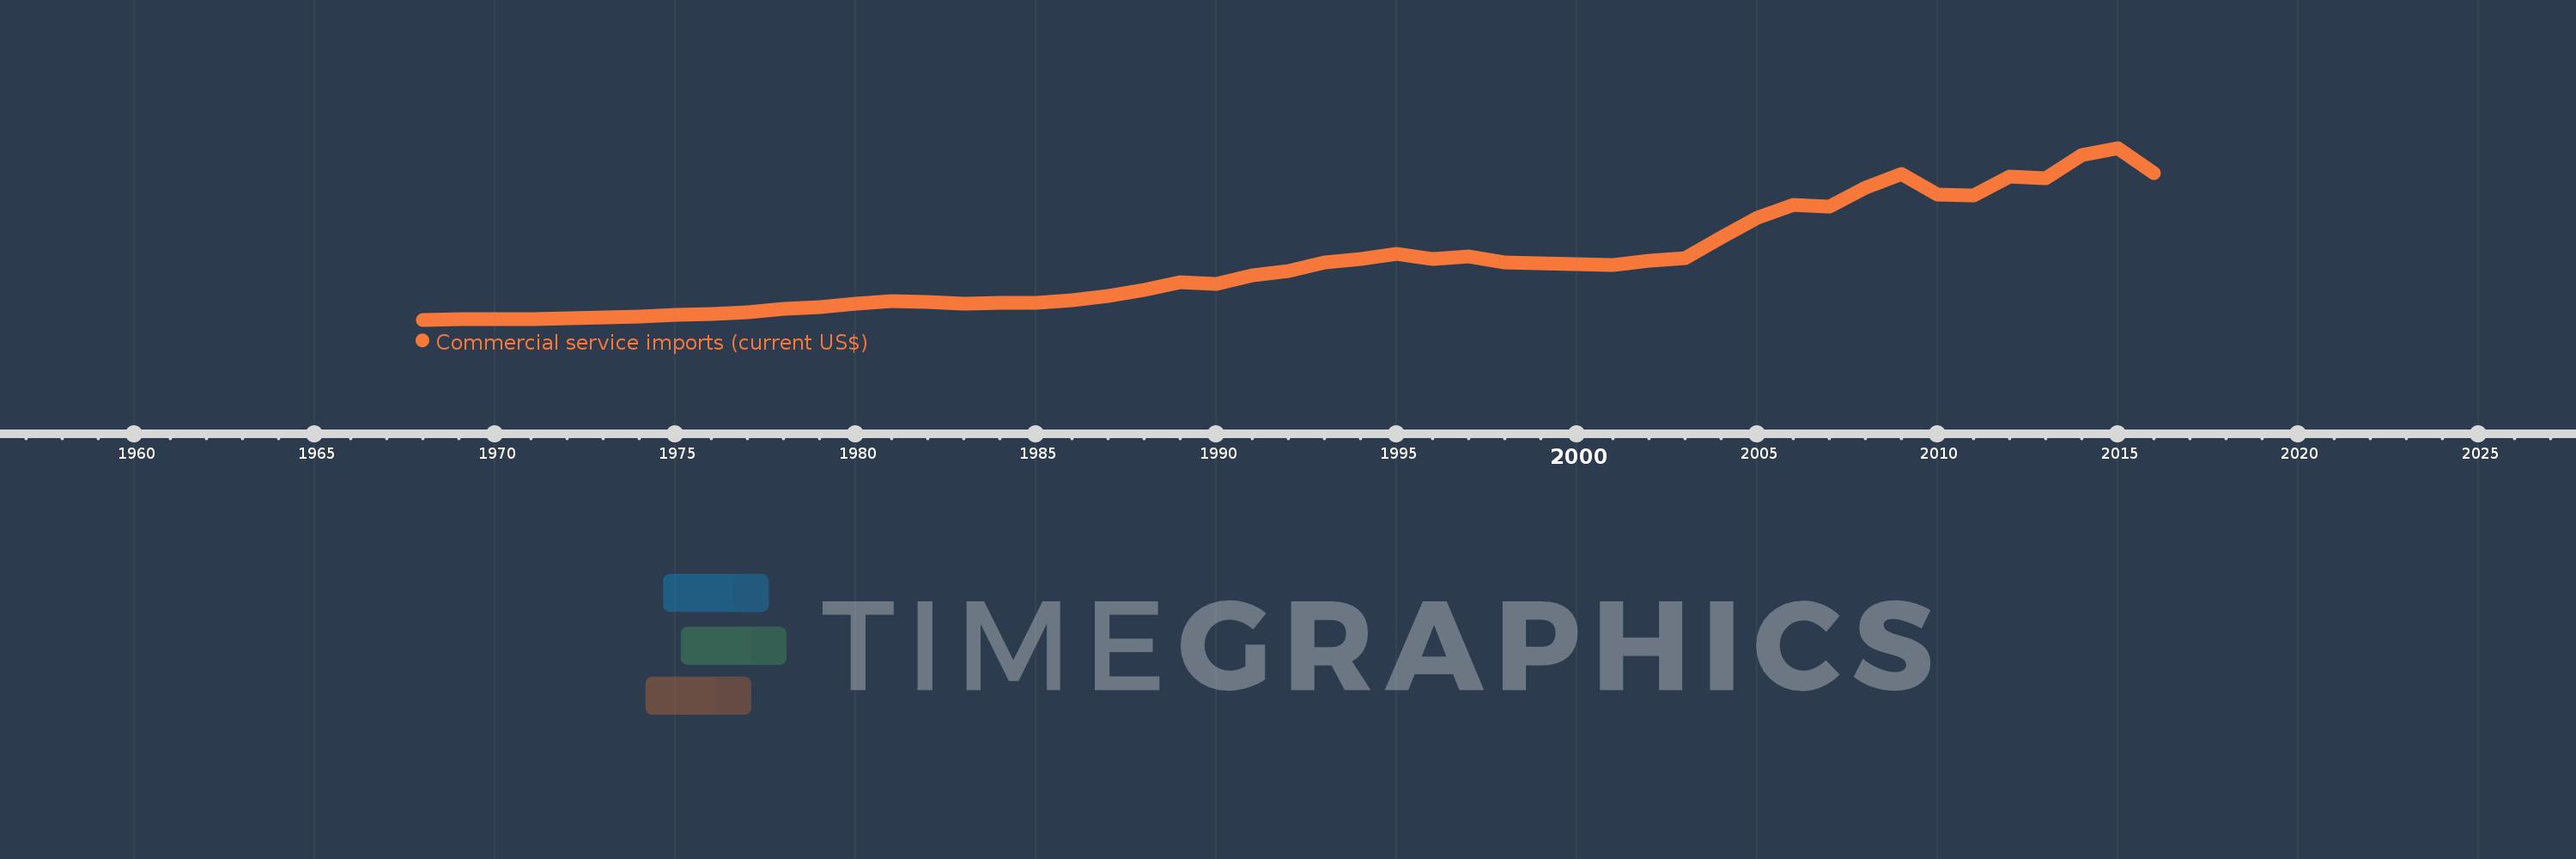
Commercial service imports (current US$)
2016,2015,2014,2013,2012,2011,2010,2009,2008,2007,2006,2005,2004,2003,2002,2001,2000,1999,1998,1997,1996,1995,1994,1993,1992,1991,1990,1989,1988,1987,1986,1985,1984,1983,1982,1981,1980,1979,1978,1977,1976,1975,1974,1973,1972,1971,1970,1969,1968
This statistics in other country:
AfghanistanAlbaniaAlgeriaAngolaAntigua and BarbudaArab WorldArgentinaArmeniaArubaAustraliaAustriaAzerbaijanBahamas, TheBahrainBangladeshBarbadosBelarusBelgiumBelizeBeninBermudaBhutanBoliviaBosnia and HerzegovinaBotswanaBrazilBrunei DarussalamBulgariaBurkina FasoBurundiCabo VerdeCambodiaCameroonCanadaCaribbean small statesCentral African RepublicCentral Europe and the BalticsChadChileChinaColombiaComorosCongo, Dem. Rep.Congo, Rep.Costa RicaCote d'IvoireCroatiaCuracaoCyprusCzech RepublicDenmarkDjiboutiDominicaDominican RepublicEarly-demographic dividendEast Asia & PacificEast Asia & Pacific (excluding high income)East Asia & Pacific (IDA & IBRD countries)EcuadorEgypt, Arab Rep.El SalvadorEquatorial GuineaEritreaEstoniaEthiopiaEuro areaEurope & Central AsiaEurope & Central Asia (excluding high income)Europe & Central Asia (IDA & IBRD countries)European UnionFaroe IslandsFijiFinlandFragile and conflict affected situationsFranceFrench PolynesiaGabonGambia, TheGeorgiaGermanyGhanaGreeceGrenadaGuatemalaGuineaGuinea-BissauGuyanaHaitiHeavily indebted poor countries (HIPC)High incomeHondurasHong Kong SAR, ChinaHungaryIBRD onlyIcelandIDA & IBRD totalIDA blendIDA onlyIDA totalIndiaIndonesiaIran, Islamic Rep.IraqIrelandIsraelItalyJamaicaJapanJordanKazakhstanKenyaKiribatiKorea, Rep.KosovoKuwaitKyrgyz RepublicLao PDRLate-demographic dividendLatin America & Caribbean Latin America & Caribbean (excluding high income)Latin America & the Caribbean (IDA & IBRD countries)LatviaLeast developed countries: UN classificationLebanonLesothoLiberiaLibyaLithuaniaLow & middle incomeLow incomeLower middle incomeLuxembourgMacao SAR, ChinaMacedonia, FYRMadagascarMalawiMalaysiaMaldivesMaliMaltaMarshall IslandsMauritaniaMauritiusMexicoMicronesia, Fed. Sts.Middle East & North Africa (excluding high income)Middle East & North Africa (IDA & IBRD countries)Middle incomeMoldovaMongoliaMontenegroMoroccoMozambiqueMyanmarNamibiaNepalNetherlandsNew CaledoniaNew ZealandNicaraguaNigerNigeriaNorth AmericaNorwayOECD membersOmanOther small statesPacific island small statesPakistanPalauPanamaPapua New GuineaParaguayPeruPhilippinesPolandPortugalPost-demographic dividendPre-demographic dividendQatarRomaniaRussian FederationRwandaSamoaSao Tome and PrincipeSaudi ArabiaSenegalSerbiaSeychellesSierra LeoneSingaporeSint Maarten (Dutch part)Slovak RepublicSloveniaSmall statesSolomon IslandsSouth AfricaSouth AsiaSouth Asia (IDA & IBRD)South SudanSpainSri LankaSt. Kitts and NevisSt. LuciaSt. Vincent and the GrenadinesSub-Saharan Africa Sub-Saharan Africa (excluding high income)Sub-Saharan Africa (IDA & IBRD countries)SudanSurinameSwazilandSwedenSwitzerlandSyrian Arab RepublicTajikistanTanzaniaThailandTimor-LesteTogoTongaTrinidad and TobagoTunisiaTurkeyTuvaluUgandaUkraineUnited KingdomUnited StatesUpper middle incomeUruguayVanuatuVenezuela, RBVietnamWest Bank and GazaWorldYemen, Rep.ZambiaZimbabwe Timeline:
This timeline shows a graph from 1968 to 2016 of Austria. No data until 1967. Number of actual observations by date: 49.
Source name:
World Development Indicators
Source organization:
International Monetary Fund, Balance of Payments Statistics Yearbook and data files.
Categories, topics:
Private Sector, Trade
Last updated:
apr 23, 2017
Indicators value changes by year
Minimum:
477.808 mln
jan 1, 1968
Maximum:
53.205 bln
jan 1, 2015
At the date of observation
Value
Absolute change
Change from previous value
jan 1, 1968
477.808 mln
+477.808 mln
0.0%
jan 1, 1969
542.346 mln
+64.538 mln
13.51%
jan 1, 1970
654.038 mln
+111.692 mln
20.59%
jan 1, 1971
723.962 mln
+69.923 mln
10.69%
jan 1, 1972
839.053 mln
+115.091 mln
15.9%
jan 1, 1973
1.074 bln
+235.445 mln
28.06%
jan 1, 1974
1.516 bln
+441.64 mln
41.1%
jan 1, 1975
1.857 bln
+340.722 mln
22.47%
jan 1, 1976
2.302 bln
+444.784 mln
23.95%
jan 1, 1977
2.876 bln
+573.899 mln
24.93%
jan 1, 1978
3.718 bln
+842.666 mln
29.3%
jan 1, 1979
4.362 bln
+643.493 mln
17.31%
jan 1, 1980
5.414 bln
+1.052 bln
24.12%
jan 1, 1981
6.277 bln
+862.98 mln
15.94%
jan 1, 1982
5.819 bln
-457.458 mln
-7.29%
jan 1, 1983
5.367 bln
-452.729 mln
-7.78%
jan 1, 1984
5.734 bln
+367.33 mln
6.84%
jan 1, 1985
5.789 bln
+55.181 mln
0.96%
jan 1, 1986
6.405 bln
+616.278 mln
10.65%
jan 1, 1987
7.656 bln
+1.25 bln
19.52%
jan 1, 1988
9.664 bln
+2.008 bln
26.23%
jan 1, 1989
12.111 bln
+2.447 bln
25.32%
jan 1, 1990
11.557 bln
-554.088 mln
-4.58%
jan 1, 1991
14.232 bln
+2.675 bln
23.15%
jan 1, 1992
15.363 bln
+1.131 bln
7.95%
jan 1, 1993
17.956 bln
+2.593 bln
16.88%
jan 1, 1994
19.186 bln
+1.23 bln
6.85%
jan 1, 1995
20.743 bln
+1.557 bln
8.12%
jan 1, 1996
19.004 bln
-1.74 bln
-8.39%
jan 1, 1997
19.994 bln
+990.342 mln
5.21%
jan 1, 1998
17.998 bln
-1.996 bln
-9.98%
jan 1, 1999
17.905 bln
-92.608 mln
-0.51%
jan 1, 2000
17.53 bln
-374.606 mln
-2.09%
jan 1, 2001
17.264 bln
-266.264 mln
-1.52%
jan 1, 2002
18.51 bln
+1.246 bln
7.22%
jan 1, 2003
19.472 bln
+961.721 mln
5.2%
jan 1, 2004
25.694 bln
+6.222 bln
31.95%
jan 1, 2005
31.887 bln
+6.194 bln
24.11%
jan 1, 2006
35.7 bln
+3.813 bln
11.96%
jan 1, 2007
35.109 bln
-591.269 mln
-1.66%
jan 1, 2008
40.922 bln
+5.814 bln
16.56%
jan 1, 2009
45.142 bln
+4.22 bln
10.31%
jan 1, 2010
38.923 bln
-6.219 bln
-13.78%
jan 1, 2011
38.643 bln
-280.405 mln
-0.72%
jan 1, 2012
44.363 bln
+5.72 bln
14.8%
jan 1, 2013
44.009 bln
-354.545 mln
-0.8%
jan 1, 2014
50.913 bln
+6.905 bln
15.69%
jan 1, 2015
53.205 bln
+2.292 bln
4.5%
jan 1, 2016
45.498 bln
-7.707 bln
-14.49%
Ranking of countries by current statistics by years


Comments: