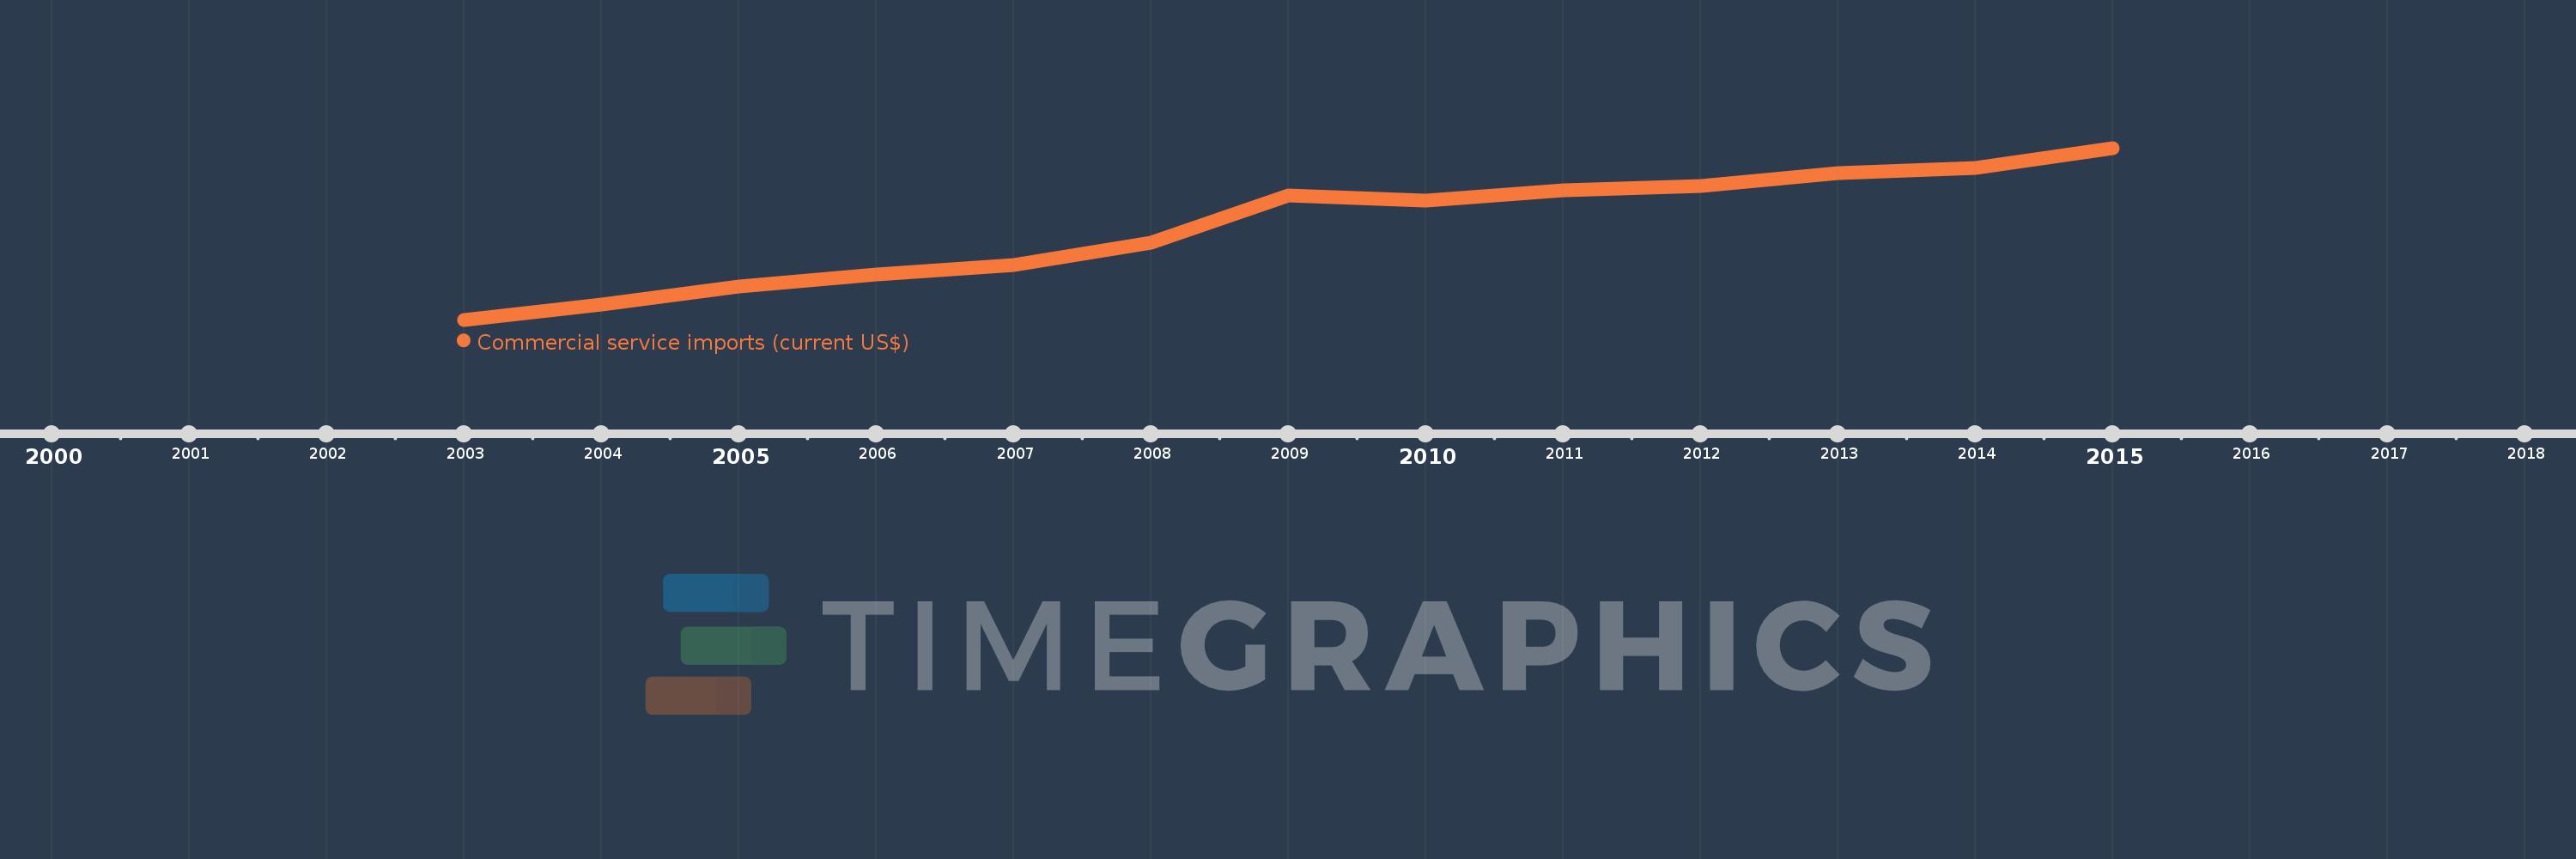
This timeline shows a graph from 2003 to 2015 of Middle East & North Africa (excluding high income). No data until 2002. Number of actual observations by date: 13.
Source name:
World Development Indicators
Source organization:
International Monetary Fund, Balance of Payments Statistics Yearbook and data files.
Categories, topics:
Private Sector, Trade
Last updated:
apr 23, 2017
Indicators value changes by year
Meaning:
71.873 bln
Minimum:
30.101 bln
jan 1, 2003
Maximum:
107.648 bln
jan 1, 2015
At the date of observation
Value
Absolute change
Change from the previous value
jan 1, 2003
30.101 bln
+30.101 bln
0.0%
jan 1, 2004
36.836 bln
+6.735 bln
22.38%
jan 1, 2005
45.204 bln
+8.368 bln
22.72%
jan 1, 2006
50.671 bln
+5.467 bln
12.09%
jan 1, 2007
54.739 bln
+4.068 bln
8.03%
jan 1, 2008
64.879 bln
+10.14 bln
18.52%
jan 1, 2009
86.281 bln
+21.403 bln
32.99%
jan 1, 2010
83.839 bln
-2.443 bln
-2.83%
jan 1, 2011
88.69 bln
+4.851 bln
5.79%
jan 1, 2012
90.454 bln
+1.764 bln
1.99%
jan 1, 2013
96.304 bln
+5.849 bln
6.47%
jan 1, 2014
98.698 bln
+2.394 bln
2.49%
jan 1, 2015
107.648 bln
+8.95 bln
9.07%
Ranking of countries by current statistics by years
