29
/
en
AIzaSyAYiBZKx7MnpbEhh9jyipgxe19OcubqV5w
April 1, 2024
167236
Kenya
KEN
true
2
1
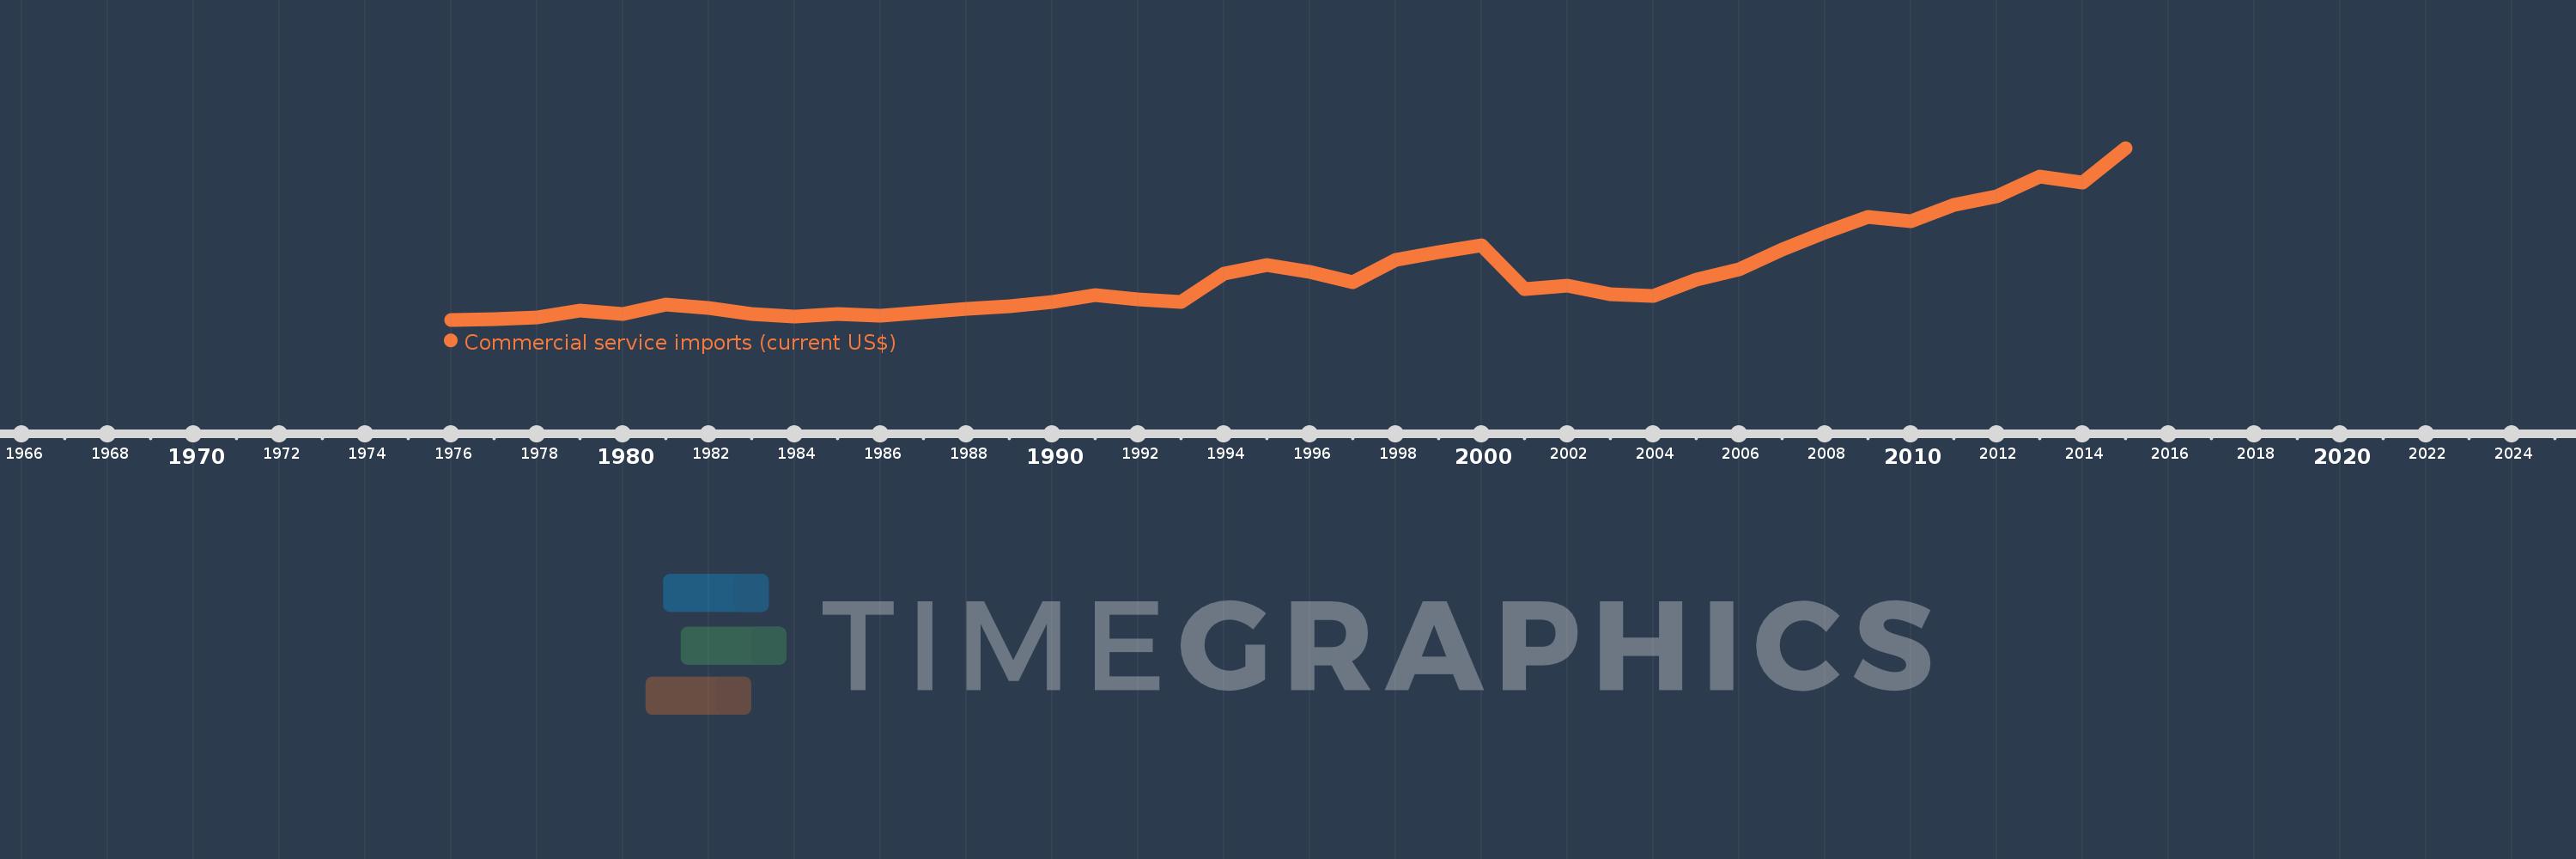
Commercial service imports (current US$)
2015,2014,2013,2012,2011,2010,2009,2008,2007,2006,2005,2004,2003,2002,2001,2000,1999,1998,1997,1996,1995,1994,1993,1992,1991,1990,1989,1988,1987,1986,1985,1984,1983,1982,1981,1980,1979,1978,1977,1976
This statistics in other country:
AfghanistanAlbaniaAlgeriaAngolaAntigua and BarbudaArab WorldArgentinaArmeniaArubaAustraliaAustriaAzerbaijanBahamas, TheBahrainBangladeshBarbadosBelarusBelgiumBelizeBeninBermudaBhutanBoliviaBosnia and HerzegovinaBotswanaBrazilBrunei DarussalamBulgariaBurkina FasoBurundiCabo VerdeCambodiaCameroonCanadaCaribbean small statesCentral African RepublicCentral Europe and the BalticsChadChileChinaColombiaComorosCongo, Dem. Rep.Congo, Rep.Costa RicaCote d'IvoireCroatiaCuracaoCyprusCzech RepublicDenmarkDjiboutiDominicaDominican RepublicEarly-demographic dividendEast Asia & PacificEast Asia & Pacific (excluding high income)East Asia & Pacific (IDA & IBRD countries)EcuadorEgypt, Arab Rep.El SalvadorEquatorial GuineaEritreaEstoniaEthiopiaEuro areaEurope & Central AsiaEurope & Central Asia (excluding high income)Europe & Central Asia (IDA & IBRD countries)European UnionFaroe IslandsFijiFinlandFragile and conflict affected situationsFranceFrench PolynesiaGabonGambia, TheGeorgiaGermanyGhanaGreeceGrenadaGuatemalaGuineaGuinea-BissauGuyanaHaitiHeavily indebted poor countries (HIPC)High incomeHondurasHong Kong SAR, ChinaHungaryIBRD onlyIcelandIDA & IBRD totalIDA blendIDA onlyIDA totalIndiaIndonesiaIran, Islamic Rep.IraqIrelandIsraelItalyJamaicaJapanJordanKazakhstanKenyaKiribatiKorea, Rep.KosovoKuwaitKyrgyz RepublicLao PDRLate-demographic dividendLatin America & Caribbean Latin America & Caribbean (excluding high income)Latin America & the Caribbean (IDA & IBRD countries)LatviaLeast developed countries: UN classificationLebanonLesothoLiberiaLibyaLithuaniaLow & middle incomeLow incomeLower middle incomeLuxembourgMacao SAR, ChinaMacedonia, FYRMadagascarMalawiMalaysiaMaldivesMaliMaltaMarshall IslandsMauritaniaMauritiusMexicoMicronesia, Fed. Sts.Middle East & North Africa (excluding high income)Middle East & North Africa (IDA & IBRD countries)Middle incomeMoldovaMongoliaMontenegroMoroccoMozambiqueMyanmarNamibiaNepalNetherlandsNew CaledoniaNew ZealandNicaraguaNigerNigeriaNorth AmericaNorwayOECD membersOmanOther small statesPacific island small statesPakistanPalauPanamaPapua New GuineaParaguayPeruPhilippinesPolandPortugalPost-demographic dividendPre-demographic dividendQatarRomaniaRussian FederationRwandaSamoaSao Tome and PrincipeSaudi ArabiaSenegalSerbiaSeychellesSierra LeoneSingaporeSint Maarten (Dutch part)Slovak RepublicSloveniaSmall statesSolomon IslandsSouth AfricaSouth AsiaSouth Asia (IDA & IBRD)South SudanSpainSri LankaSt. Kitts and NevisSt. LuciaSt. Vincent and the GrenadinesSub-Saharan Africa Sub-Saharan Africa (excluding high income)Sub-Saharan Africa (IDA & IBRD countries)SudanSurinameSwazilandSwedenSwitzerlandSyrian Arab RepublicTajikistanTanzaniaThailandTimor-LesteTogoTongaTrinidad and TobagoTunisiaTurkeyTuvaluUgandaUkraineUnited KingdomUnited StatesUpper middle incomeUruguayVanuatuVenezuela, RBVietnamWest Bank and GazaWorldYemen, Rep.ZambiaZimbabwe Timeline:
This timeline shows a graph from 1976 to 2015 of Kenya. No data until 1975. Number of actual observations by date: 40.
Source name:
World Development Indicators
Source organization:
International Monetary Fund, Balance of Payments Statistics Yearbook and data files.
Categories, topics:
Private Sector, Trade
Last updated:
apr 23, 2017
Indicators value changes by year
Minimum:
245.942 mln
jan 1, 1976
Maximum:
2.698 bln
jan 1, 2015
At the date of observation
Value
Absolute change
Change from previous value
jan 1, 1976
245.942 mln
+245.942 mln
0.0%
jan 1, 1977
258.989 mln
+13.047 mln
5.3%
jan 1, 1978
278.86 mln
+19.871 mln
7.67%
jan 1, 1979
375.839 mln
+96.979 mln
34.78%
jan 1, 1980
329.485 mln
-46.354 mln
-12.33%
jan 1, 1981
461.444 mln
+131.959 mln
40.05%
jan 1, 1982
412.49 mln
-48.954 mln
-10.61%
jan 1, 1983
327.586 mln
-84.904 mln
-20.58%
jan 1, 1984
294.557 mln
-33.029 mln
-10.08%
jan 1, 1985
324.895 mln
+30.338 mln
10.3%
jan 1, 1986
307.873 mln
-17.023 mln
-5.24%
jan 1, 1987
348.582 mln
+40.709 mln
13.22%
jan 1, 1988
397.46 mln
+48.878 mln
14.02%
jan 1, 1989
443.115 mln
+45.655 mln
11.49%
jan 1, 1990
499.697 mln
+56.582 mln
12.77%
jan 1, 1991
597.65 mln
+97.953 mln
19.6%
jan 1, 1992
541.878 mln
-55.772 mln
-9.33%
jan 1, 1993
500.887 mln
-40.991 mln
-7.56%
jan 1, 1994
903.118 mln
+402.231 mln
80.3%
jan 1, 1995
1.031 bln
+127.605 mln
14.13%
jan 1, 1996
926.277 mln
-104.446 mln
-10.13%
jan 1, 1997
785.615 mln
-140.662 mln
-15.19%
jan 1, 1998
1.103 bln
+317.877 mln
40.46%
jan 1, 1999
1.214 bln
+110.837 mln
10.04%
jan 1, 2000
1.314 bln
+100.054 mln
8.24%
jan 1, 2001
687.649 mln
-626.734 mln
-47.68%
jan 1, 2002
735.365 mln
+47.715 mln
6.94%
jan 1, 2003
604.937 mln
-130.428 mln
-17.74%
jan 1, 2004
590.899 mln
-14.037 mln
-2.32%
jan 1, 2005
818.91 mln
+228.011 mln
38.59%
jan 1, 2006
969.713 mln
+150.802 mln
18.42%
jan 1, 2007
1.252 bln
+282.413 mln
29.12%
jan 1, 2008
1.499 bln
+246.648 mln
19.7%
jan 1, 2009
1.716 bln
+217.513 mln
14.51%
jan 1, 2010
1.653 bln
-63.724 mln
-3.71%
jan 1, 2011
1.89 bln
+237.273 mln
14.36%
jan 1, 2012
2.003 bln
+113.281 mln
5.99%
jan 1, 2013
2.287 bln
+283.779 mln
14.17%
jan 1, 2014
2.206 bln
-80.673 mln
-3.53%
jan 1, 2015
2.698 bln
+492.09 mln
22.3%
Ranking of countries by current statistics by years


Comments: