29
/
en
AIzaSyAYiBZKx7MnpbEhh9jyipgxe19OcubqV5w
April 1, 2024
225712
Portugal
PRT
true
2
1
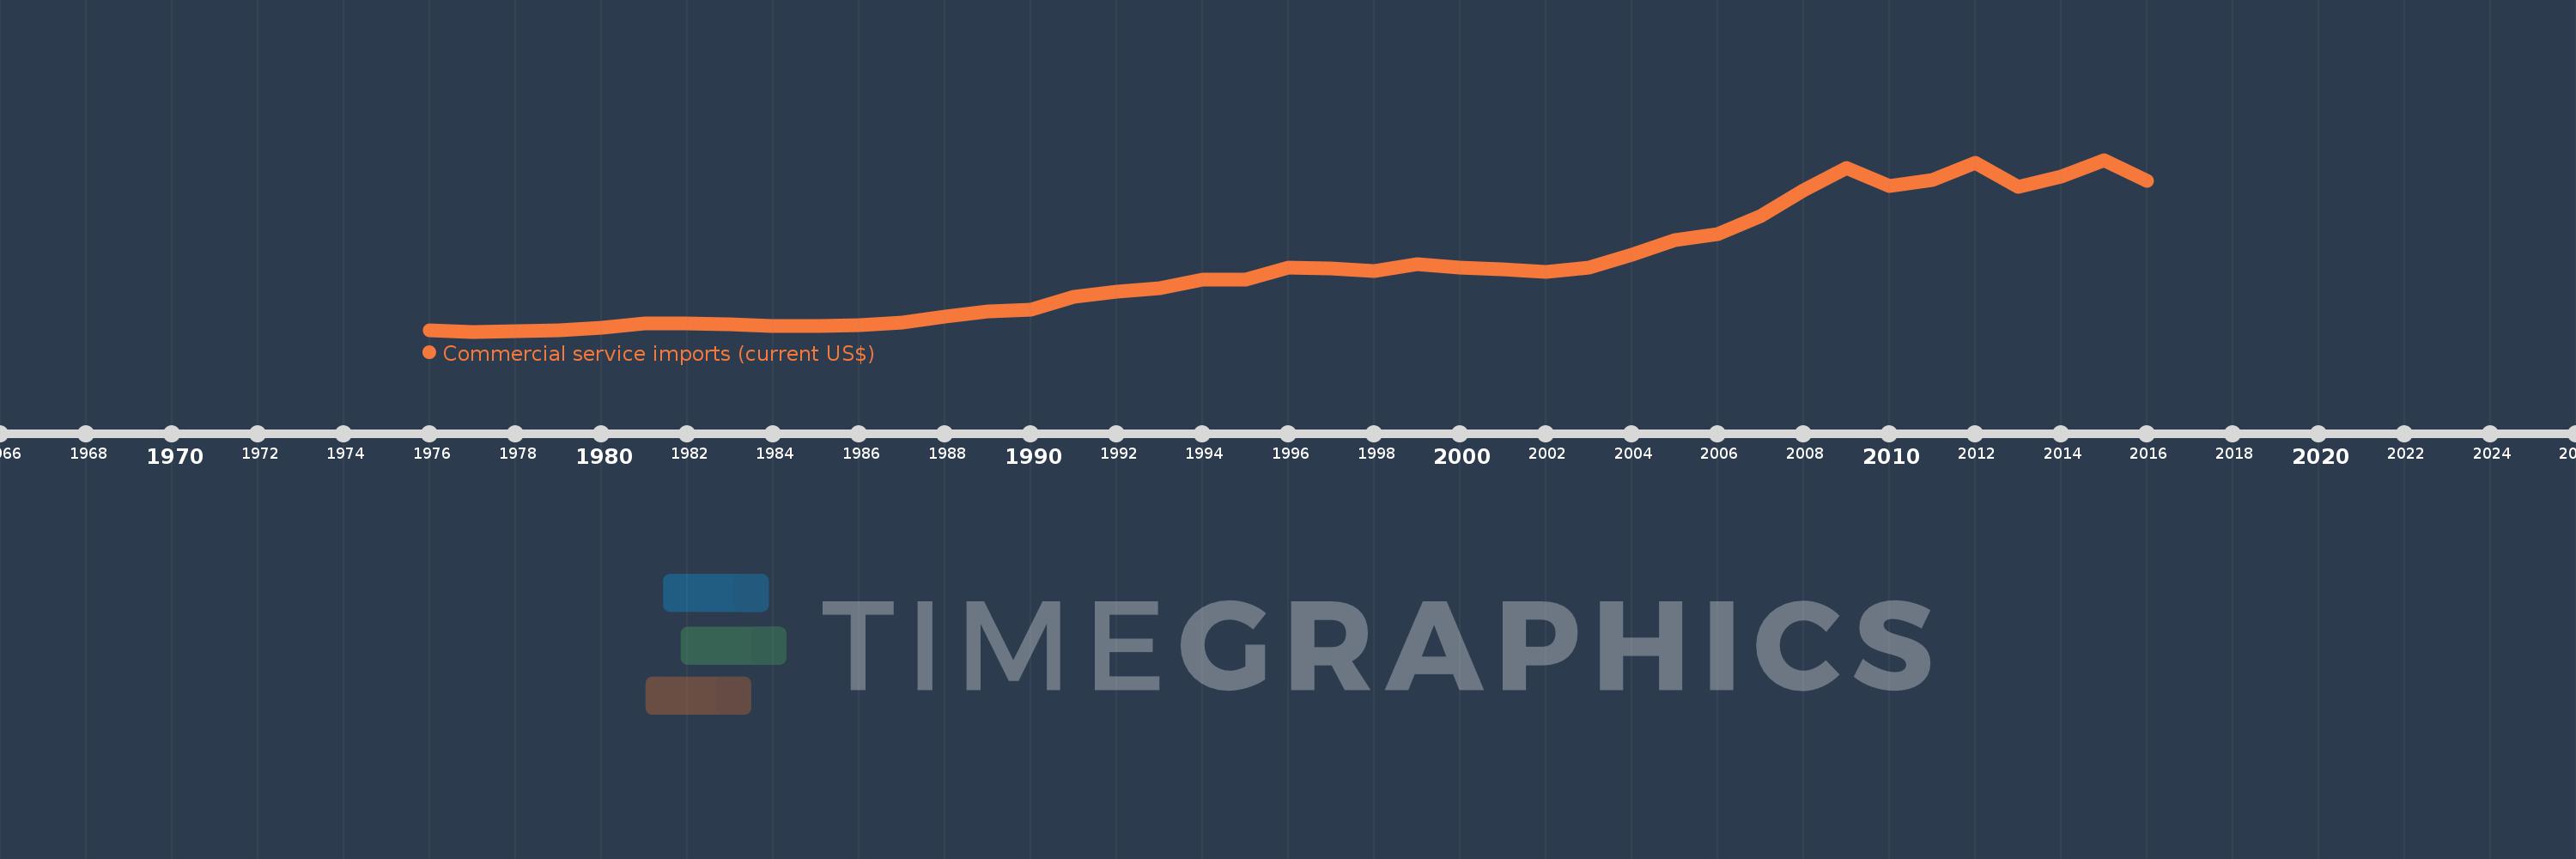
Commercial service imports (current US$)
2016,2015,2014,2013,2012,2011,2010,2009,2008,2007,2006,2005,2004,2003,2002,2001,2000,1999,1998,1997,1996,1995,1994,1993,1992,1991,1990,1989,1988,1987,1986,1985,1984,1983,1982,1981,1980,1979,1978,1977,1976
This statistics in other country:
AfghanistanAlbaniaAlgeriaAngolaAntigua and BarbudaArab WorldArgentinaArmeniaArubaAustraliaAustriaAzerbaijanBahamas, TheBahrainBangladeshBarbadosBelarusBelgiumBelizeBeninBermudaBhutanBoliviaBosnia and HerzegovinaBotswanaBrazilBrunei DarussalamBulgariaBurkina FasoBurundiCabo VerdeCambodiaCameroonCanadaCaribbean small statesCentral African RepublicCentral Europe and the BalticsChadChileChinaColombiaComorosCongo, Dem. Rep.Congo, Rep.Costa RicaCote d'IvoireCroatiaCuracaoCyprusCzech RepublicDenmarkDjiboutiDominicaDominican RepublicEarly-demographic dividendEast Asia & PacificEast Asia & Pacific (excluding high income)East Asia & Pacific (IDA & IBRD countries)EcuadorEgypt, Arab Rep.El SalvadorEquatorial GuineaEritreaEstoniaEthiopiaEuro areaEurope & Central AsiaEurope & Central Asia (excluding high income)Europe & Central Asia (IDA & IBRD countries)European UnionFaroe IslandsFijiFinlandFragile and conflict affected situationsFranceFrench PolynesiaGabonGambia, TheGeorgiaGermanyGhanaGreeceGrenadaGuatemalaGuineaGuinea-BissauGuyanaHaitiHeavily indebted poor countries (HIPC)High incomeHondurasHong Kong SAR, ChinaHungaryIBRD onlyIcelandIDA & IBRD totalIDA blendIDA onlyIDA totalIndiaIndonesiaIran, Islamic Rep.IraqIrelandIsraelItalyJamaicaJapanJordanKazakhstanKenyaKiribatiKorea, Rep.KosovoKuwaitKyrgyz RepublicLao PDRLate-demographic dividendLatin America & Caribbean Latin America & Caribbean (excluding high income)Latin America & the Caribbean (IDA & IBRD countries)LatviaLeast developed countries: UN classificationLebanonLesothoLiberiaLibyaLithuaniaLow & middle incomeLow incomeLower middle incomeLuxembourgMacao SAR, ChinaMacedonia, FYRMadagascarMalawiMalaysiaMaldivesMaliMaltaMarshall IslandsMauritaniaMauritiusMexicoMicronesia, Fed. Sts.Middle East & North Africa (excluding high income)Middle East & North Africa (IDA & IBRD countries)Middle incomeMoldovaMongoliaMontenegroMoroccoMozambiqueMyanmarNamibiaNepalNetherlandsNew CaledoniaNew ZealandNicaraguaNigerNigeriaNorth AmericaNorwayOECD membersOmanOther small statesPacific island small statesPakistanPalauPanamaPapua New GuineaParaguayPeruPhilippinesPolandPortugalPost-demographic dividendPre-demographic dividendQatarRomaniaRussian FederationRwandaSamoaSao Tome and PrincipeSaudi ArabiaSenegalSerbiaSeychellesSierra LeoneSingaporeSint Maarten (Dutch part)Slovak RepublicSloveniaSmall statesSolomon IslandsSouth AfricaSouth AsiaSouth Asia (IDA & IBRD)South SudanSpainSri LankaSt. Kitts and NevisSt. LuciaSt. Vincent and the GrenadinesSub-Saharan Africa Sub-Saharan Africa (excluding high income)Sub-Saharan Africa (IDA & IBRD countries)SudanSurinameSwazilandSwedenSwitzerlandSyrian Arab RepublicTajikistanTanzaniaThailandTimor-LesteTogoTongaTrinidad and TobagoTunisiaTurkeyTuvaluUgandaUkraineUnited KingdomUnited StatesUpper middle incomeUruguayVanuatuVenezuela, RBVietnamWest Bank and GazaWorldYemen, Rep.ZambiaZimbabwe Timeline:
This timeline shows a graph from 1976 to 2016 of Portugal. No data until 1975. Number of actual observations by date: 41.
Source name:
World Development Indicators
Source organization:
International Monetary Fund, Balance of Payments Statistics Yearbook and data files.
Categories, topics:
Private Sector, Trade
Last updated:
apr 23, 2017
Indicators value changes by year
Minimum:
643.501 mln
jan 1, 1977
Maximum:
15.913 bln
jan 1, 2015
At the date of observation
Value
Absolute change
Change from previous value
jan 1, 1976
733.416 mln
+733.416 mln
0.0%
jan 1, 1977
643.501 mln
-89.915 mln
-12.26%
jan 1, 1978
693.595 mln
+50.094 mln
7.78%
jan 1, 1979
763.878 mln
+70.283 mln
10.13%
jan 1, 1980
1.012 bln
+248.248 mln
32.5%
jan 1, 1981
1.36 bln
+347.973 mln
34.38%
jan 1, 1982
1.332 bln
-27.75 mln
-2.04%
jan 1, 1983
1.323 bln
-9.491 mln
-0.71%
jan 1, 1984
1.131 bln
-191.832 mln
-14.5%
jan 1, 1985
1.114 bln
-17.275 mln
-1.53%
jan 1, 1986
1.187 bln
+73.579 mln
6.61%
jan 1, 1987
1.436 bln
+248.986 mln
20.97%
jan 1, 1988
1.953 bln
+517.11 mln
36.0%
jan 1, 1989
2.448 bln
+494.343 mln
25.31%
jan 1, 1990
2.613 bln
+165.365 mln
6.76%
jan 1, 1991
3.772 bln
+1.159 bln
44.36%
jan 1, 1992
4.158 bln
+385.962 mln
10.23%
jan 1, 1993
4.486 bln
+327.85 mln
7.88%
jan 1, 1994
5.268 bln
+781.997 mln
17.43%
jan 1, 1995
5.25 bln
-17.942 mln
-0.34%
jan 1, 1996
6.324 bln
+1.074 bln
20.46%
jan 1, 1997
6.236 bln
-88.56 mln
-1.4%
jan 1, 1998
5.996 bln
-239.673 mln
-3.84%
jan 1, 1999
6.66 bln
+663.772 mln
11.07%
jan 1, 2000
6.346 bln
-314.038 mln
-4.72%
jan 1, 2001
6.175 bln
-170.465 mln
-2.69%
jan 1, 2002
5.928 bln
-247.438 mln
-4.01%
jan 1, 2003
6.355 bln
+426.942 mln
7.2%
jan 1, 2004
7.443 bln
+1.088 bln
17.13%
jan 1, 2005
8.759 bln
+1.315 bln
17.67%
jan 1, 2006
9.323 bln
+564.361 mln
6.44%
jan 1, 2007
10.945 bln
+1.622 bln
17.39%
jan 1, 2008
13.19 bln
+2.245 bln
20.51%
jan 1, 2009
15.215 bln
+2.026 bln
15.36%
jan 1, 2010
13.615 bln
-1.6 bln
-10.52%
jan 1, 2011
14.124 bln
+509.058 mln
3.74%
jan 1, 2012
15.619 bln
+1.496 bln
10.59%
jan 1, 2013
13.478 bln
-2.142 bln
-13.71%
jan 1, 2014
14.426 bln
+948.575 mln
7.04%
jan 1, 2015
15.913 bln
+1.487 bln
10.31%
jan 1, 2016
14.069 bln
-1.844 bln
-11.59%
Ranking of countries by current statistics by years


Comments: