29
/
en
AIzaSyAYiBZKx7MnpbEhh9jyipgxe19OcubqV5w
April 1, 2024
187560
Malaysia
MYS
true
2
1
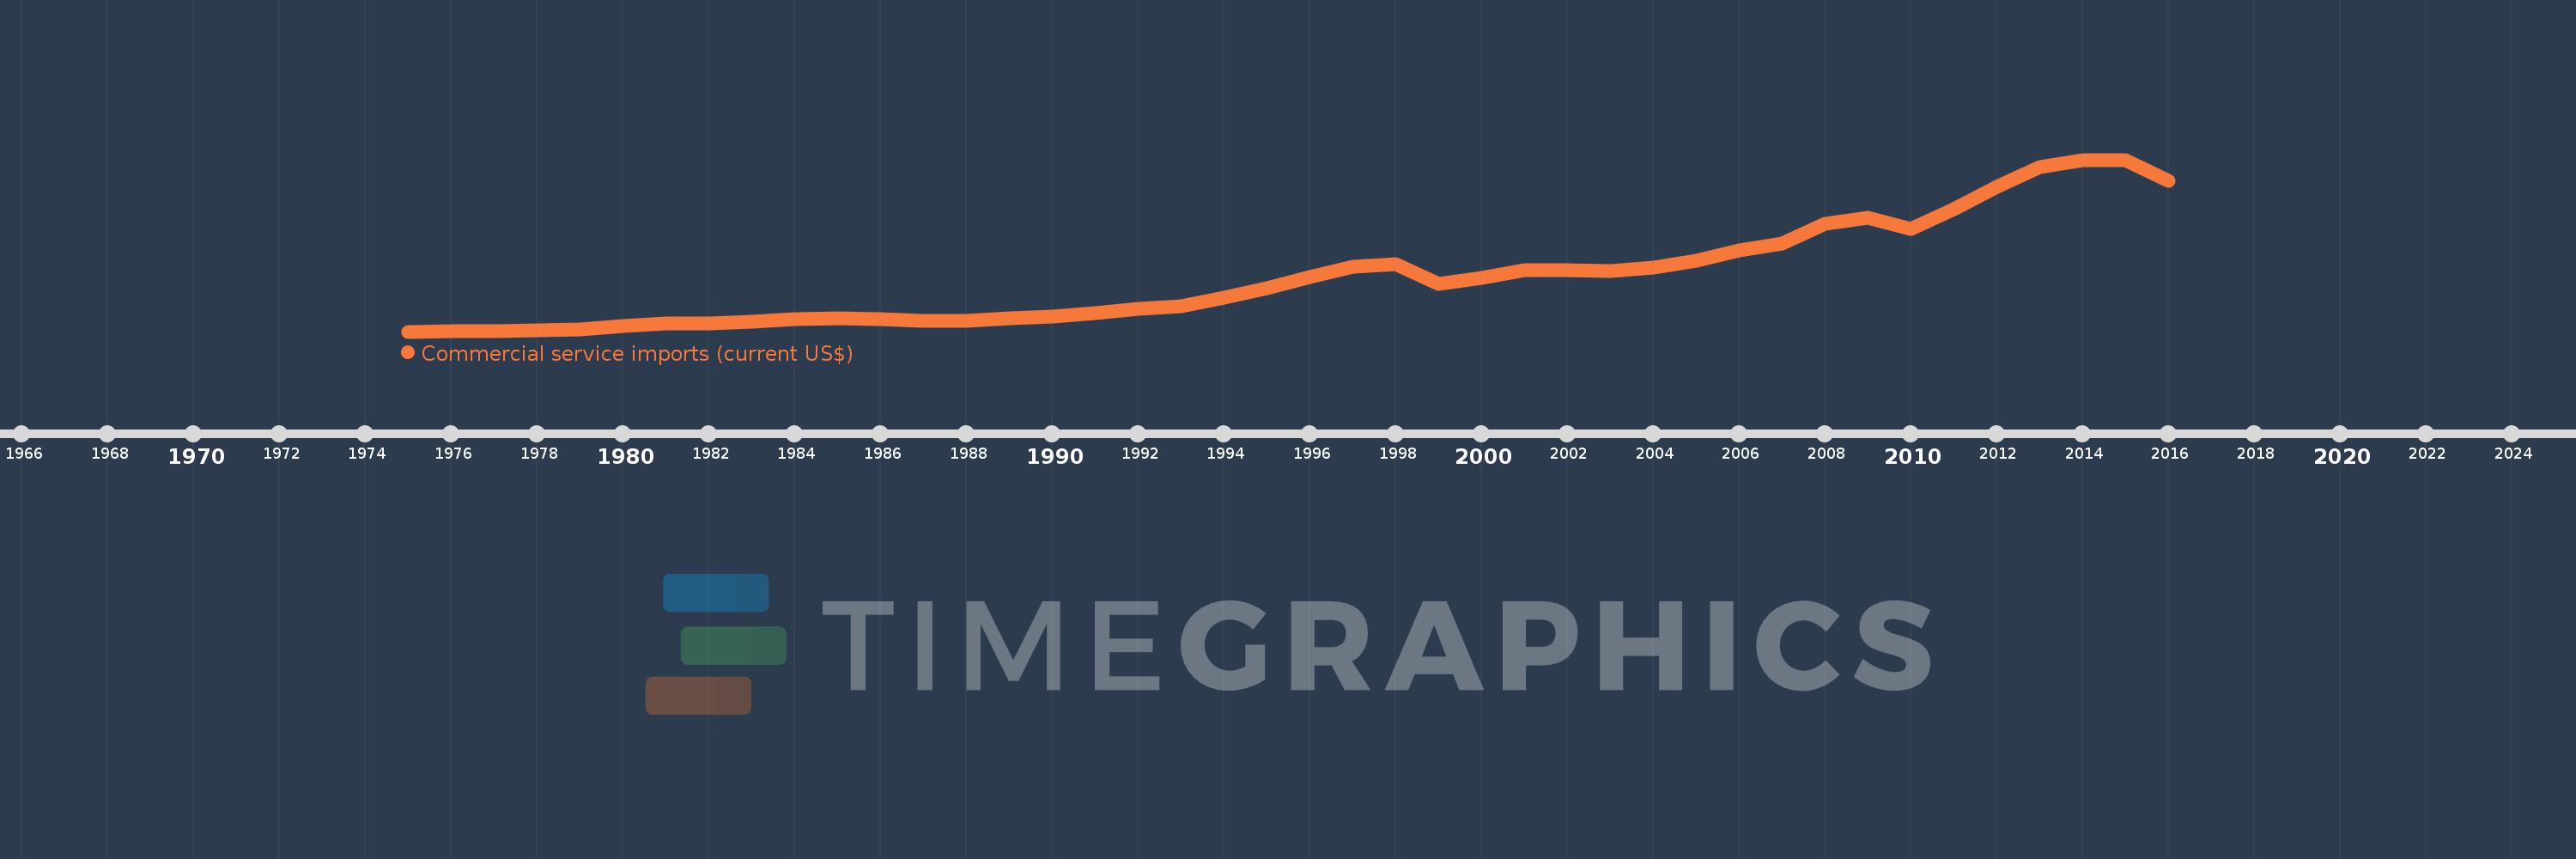
Commercial service imports (current US$)
2016,2015,2014,2013,2012,2011,2010,2009,2008,2007,2006,2005,2004,2003,2002,2001,2000,1999,1998,1997,1996,1995,1994,1993,1992,1991,1990,1989,1988,1987,1986,1985,1984,1983,1982,1981,1980,1979,1978,1977,1976,1975
This statistics in other country:
AfghanistanAlbaniaAlgeriaAngolaAntigua and BarbudaArab WorldArgentinaArmeniaArubaAustraliaAustriaAzerbaijanBahamas, TheBahrainBangladeshBarbadosBelarusBelgiumBelizeBeninBermudaBhutanBoliviaBosnia and HerzegovinaBotswanaBrazilBrunei DarussalamBulgariaBurkina FasoBurundiCabo VerdeCambodiaCameroonCanadaCaribbean small statesCentral African RepublicCentral Europe and the BalticsChadChileChinaColombiaComorosCongo, Dem. Rep.Congo, Rep.Costa RicaCote d'IvoireCroatiaCuracaoCyprusCzech RepublicDenmarkDjiboutiDominicaDominican RepublicEarly-demographic dividendEast Asia & PacificEast Asia & Pacific (excluding high income)East Asia & Pacific (IDA & IBRD countries)EcuadorEgypt, Arab Rep.El SalvadorEquatorial GuineaEritreaEstoniaEthiopiaEuro areaEurope & Central AsiaEurope & Central Asia (excluding high income)Europe & Central Asia (IDA & IBRD countries)European UnionFaroe IslandsFijiFinlandFragile and conflict affected situationsFranceFrench PolynesiaGabonGambia, TheGeorgiaGermanyGhanaGreeceGrenadaGuatemalaGuineaGuinea-BissauGuyanaHaitiHeavily indebted poor countries (HIPC)High incomeHondurasHong Kong SAR, ChinaHungaryIBRD onlyIcelandIDA & IBRD totalIDA blendIDA onlyIDA totalIndiaIndonesiaIran, Islamic Rep.IraqIrelandIsraelItalyJamaicaJapanJordanKazakhstanKenyaKiribatiKorea, Rep.KosovoKuwaitKyrgyz RepublicLao PDRLate-demographic dividendLatin America & Caribbean Latin America & Caribbean (excluding high income)Latin America & the Caribbean (IDA & IBRD countries)LatviaLeast developed countries: UN classificationLebanonLesothoLiberiaLibyaLithuaniaLow & middle incomeLow incomeLower middle incomeLuxembourgMacao SAR, ChinaMacedonia, FYRMadagascarMalawiMalaysiaMaldivesMaliMaltaMarshall IslandsMauritaniaMauritiusMexicoMicronesia, Fed. Sts.Middle East & North Africa (excluding high income)Middle East & North Africa (IDA & IBRD countries)Middle incomeMoldovaMongoliaMontenegroMoroccoMozambiqueMyanmarNamibiaNepalNetherlandsNew CaledoniaNew ZealandNicaraguaNigerNigeriaNorth AmericaNorwayOECD membersOmanOther small statesPacific island small statesPakistanPalauPanamaPapua New GuineaParaguayPeruPhilippinesPolandPortugalPost-demographic dividendPre-demographic dividendQatarRomaniaRussian FederationRwandaSamoaSao Tome and PrincipeSaudi ArabiaSenegalSerbiaSeychellesSierra LeoneSingaporeSint Maarten (Dutch part)Slovak RepublicSloveniaSmall statesSolomon IslandsSouth AfricaSouth AsiaSouth Asia (IDA & IBRD)South SudanSpainSri LankaSt. Kitts and NevisSt. LuciaSt. Vincent and the GrenadinesSub-Saharan Africa Sub-Saharan Africa (excluding high income)Sub-Saharan Africa (IDA & IBRD countries)SudanSurinameSwazilandSwedenSwitzerlandSyrian Arab RepublicTajikistanTanzaniaThailandTimor-LesteTogoTongaTrinidad and TobagoTunisiaTurkeyTuvaluUgandaUkraineUnited KingdomUnited StatesUpper middle incomeUruguayVanuatuVenezuela, RBVietnamWest Bank and GazaWorldYemen, Rep.ZambiaZimbabwe Timeline:
This timeline shows a graph from 1975 to 2016 of Malaysia. No data until 1974. Number of actual observations by date: 42.
Source name:
World Development Indicators
Source organization:
International Monetary Fund, Balance of Payments Statistics Yearbook and data files.
Categories, topics:
Private Sector, Trade
Last updated:
apr 23, 2017
Indicators value changes by year
Minimum:
663.879 mln
jan 1, 1975
Maximum:
45.128 bln
jan 1, 2015
At the date of observation
Value
Absolute change
Change from previous value
jan 1, 1975
663.879 mln
+663.879 mln
0.0%
jan 1, 1976
805.002 mln
+141.123 mln
21.26%
jan 1, 1977
785.34 mln
-19.662 mln
-2.44%
jan 1, 1978
992.165 mln
+206.826 mln
26.34%
jan 1, 1979
1.285 bln
+293.217 mln
29.55%
jan 1, 1980
2.018 bln
+732.491 mln
56.99%
jan 1, 1981
2.865 bln
+846.772 mln
41.96%
jan 1, 1982
2.768 bln
-97.001 mln
-3.39%
jan 1, 1983
3.181 bln
+412.978 mln
14.92%
jan 1, 1984
3.872 bln
+690.998 mln
21.73%
jan 1, 1985
4.156 bln
+284.305 mln
7.34%
jan 1, 1986
3.814 bln
-341.652 mln
-8.22%
jan 1, 1987
3.418 bln
-396.416 mln
-10.39%
jan 1, 1988
3.416 bln
-1.891 mln
-0.06%
jan 1, 1989
4.026 bln
+609.567 mln
17.84%
jan 1, 1990
4.604 bln
+578.279 mln
14.37%
jan 1, 1991
5.394 bln
+790.152 mln
17.16%
jan 1, 1992
6.455 bln
+1.061 bln
19.67%
jan 1, 1993
7.248 bln
+793.469 mln
12.29%
jan 1, 1994
9.371 bln
+2.122 bln
29.28%
jan 1, 1995
11.918 bln
+2.547 bln
27.18%
jan 1, 1996
14.821 bln
+2.903 bln
24.36%
jan 1, 1997
17.406 bln
+2.584 bln
17.44%
jan 1, 1998
18.115 bln
+708.853 mln
4.07%
jan 1, 1999
12.973 bln
-5.142 bln
-28.39%
jan 1, 2000
14.621 bln
+1.649 bln
12.71%
jan 1, 2001
16.603 bln
+1.981 bln
13.55%
jan 1, 2002
16.539 bln
-63.947 mln
-0.39%
jan 1, 2003
16.248 bln
-290.421 mln
-1.76%
jan 1, 2004
17.323 bln
+1.075 bln
6.61%
jan 1, 2005
18.967 bln
+1.644 bln
9.49%
jan 1, 2006
21.75 bln
+2.784 bln
14.68%
jan 1, 2007
23.421 bln
+1.671 bln
7.68%
jan 1, 2008
28.475 bln
+5.054 bln
21.58%
jan 1, 2009
30.06 bln
+1.585 bln
5.57%
jan 1, 2010
27.257 bln
-2.803 bln
-9.33%
jan 1, 2011
32.4 bln
+5.144 bln
18.87%
jan 1, 2012
38.083 bln
+5.682 bln
17.54%
jan 1, 2013
43.131 bln
+5.048 bln
13.26%
jan 1, 2014
44.973 bln
+1.843 bln
4.27%
jan 1, 2015
45.128 bln
+154.946 mln
0.34%
jan 1, 2016
39.757 bln
-5.371 bln
-11.9%
Ranking of countries by current statistics by years


Comments: