29
/
en
AIzaSyAYiBZKx7MnpbEhh9jyipgxe19OcubqV5w
April 1, 2024
136503
Gambia, The
GMB
true
2
1
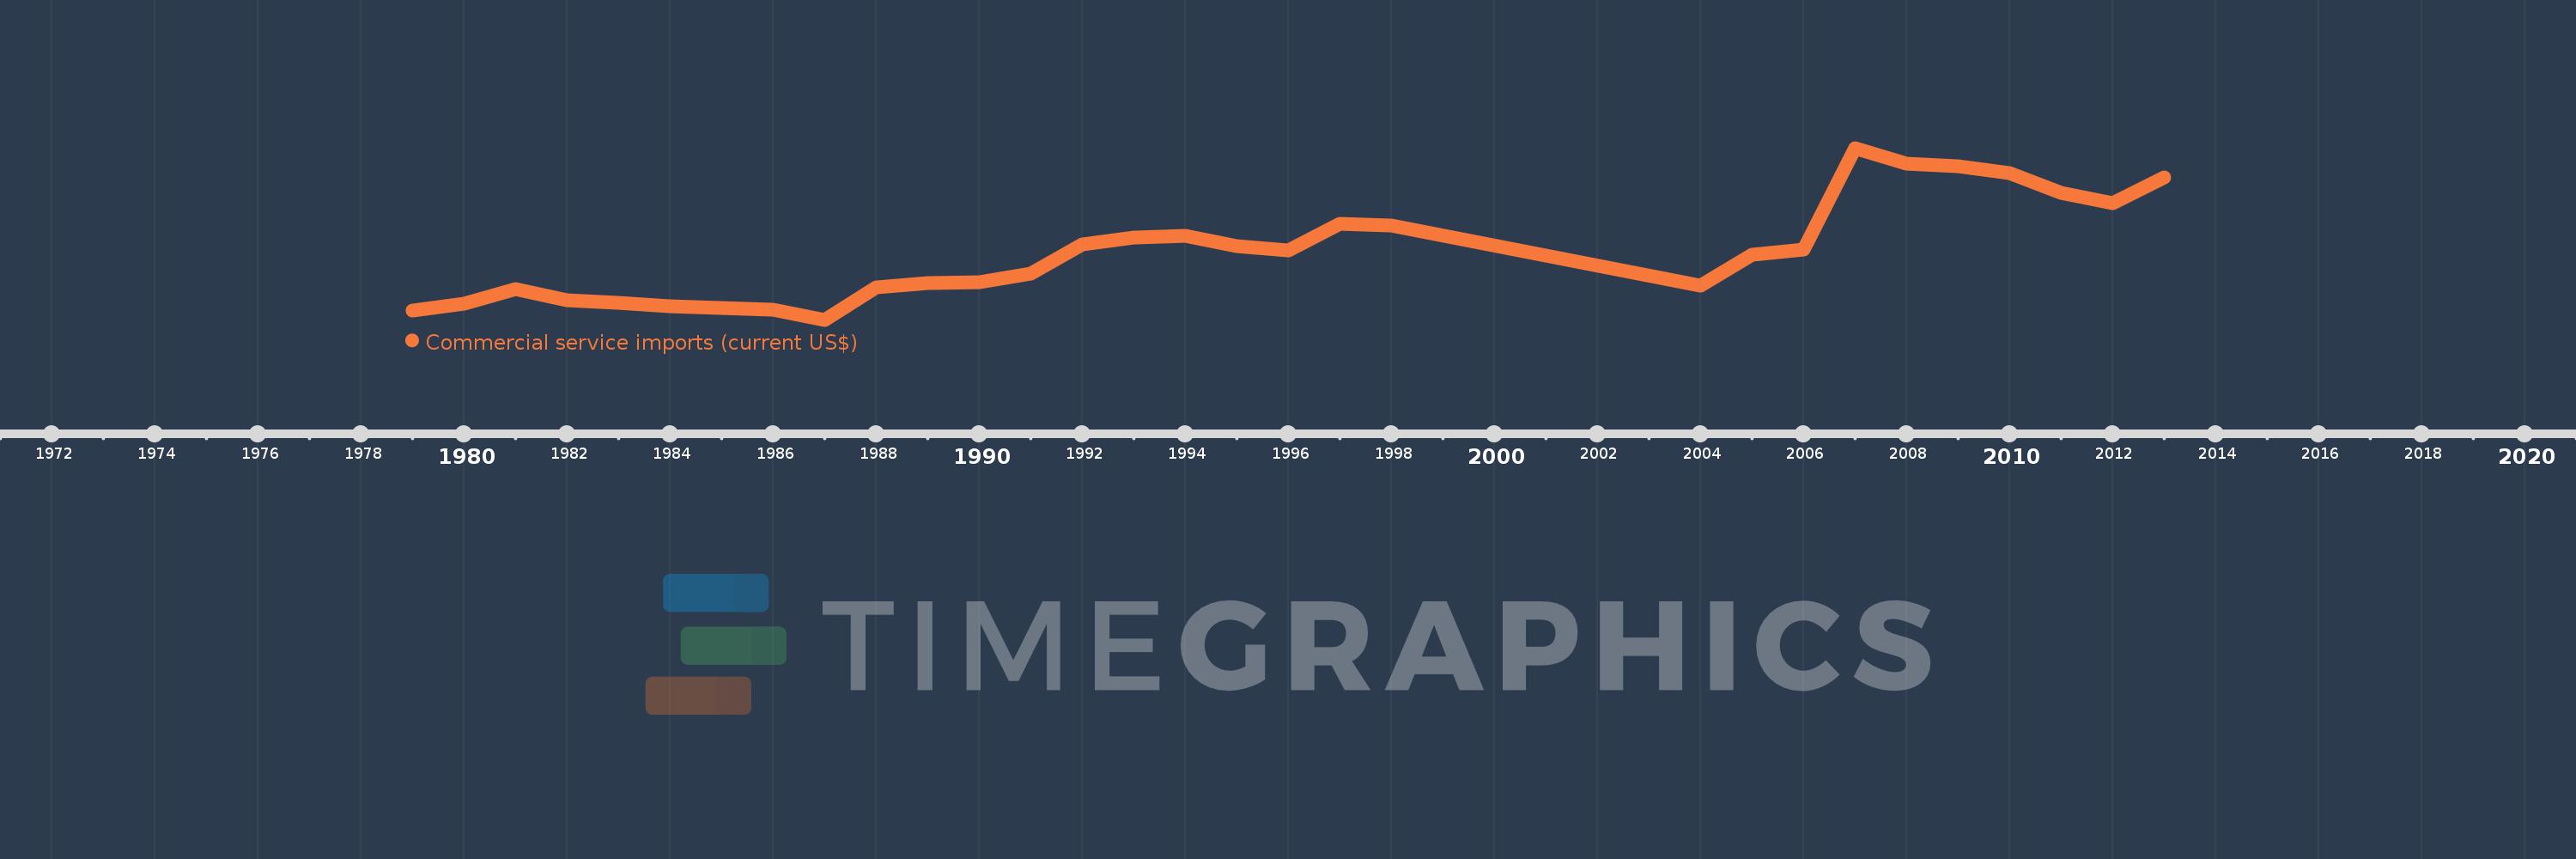
Commercial service imports (current US$)
2013,2012,2011,2010,2009,2008,2007,2006,2005,2004,1998,1997,1996,1995,1994,1993,1992,1991,1990,1989,1988,1987,1986,1985,1984,1983,1982,1981,1980,1979
This statistics in other country:
AfghanistanAlbaniaAlgeriaAngolaAntigua and BarbudaArab WorldArgentinaArmeniaArubaAustraliaAustriaAzerbaijanBahamas, TheBahrainBangladeshBarbadosBelarusBelgiumBelizeBeninBermudaBhutanBoliviaBosnia and HerzegovinaBotswanaBrazilBrunei DarussalamBulgariaBurkina FasoBurundiCabo VerdeCambodiaCameroonCanadaCaribbean small statesCentral African RepublicCentral Europe and the BalticsChadChileChinaColombiaComorosCongo, Dem. Rep.Congo, Rep.Costa RicaCote d'IvoireCroatiaCuracaoCyprusCzech RepublicDenmarkDjiboutiDominicaDominican RepublicEarly-demographic dividendEast Asia & PacificEast Asia & Pacific (excluding high income)East Asia & Pacific (IDA & IBRD countries)EcuadorEgypt, Arab Rep.El SalvadorEquatorial GuineaEritreaEstoniaEthiopiaEuro areaEurope & Central AsiaEurope & Central Asia (excluding high income)Europe & Central Asia (IDA & IBRD countries)European UnionFaroe IslandsFijiFinlandFragile and conflict affected situationsFranceFrench PolynesiaGabonGambia, TheGeorgiaGermanyGhanaGreeceGrenadaGuatemalaGuineaGuinea-BissauGuyanaHaitiHeavily indebted poor countries (HIPC)High incomeHondurasHong Kong SAR, ChinaHungaryIBRD onlyIcelandIDA & IBRD totalIDA blendIDA onlyIDA totalIndiaIndonesiaIran, Islamic Rep.IraqIrelandIsraelItalyJamaicaJapanJordanKazakhstanKenyaKiribatiKorea, Rep.KosovoKuwaitKyrgyz RepublicLao PDRLate-demographic dividendLatin America & Caribbean Latin America & Caribbean (excluding high income)Latin America & the Caribbean (IDA & IBRD countries)LatviaLeast developed countries: UN classificationLebanonLesothoLiberiaLibyaLithuaniaLow & middle incomeLow incomeLower middle incomeLuxembourgMacao SAR, ChinaMacedonia, FYRMadagascarMalawiMalaysiaMaldivesMaliMaltaMarshall IslandsMauritaniaMauritiusMexicoMicronesia, Fed. Sts.Middle East & North Africa (excluding high income)Middle East & North Africa (IDA & IBRD countries)Middle incomeMoldovaMongoliaMontenegroMoroccoMozambiqueMyanmarNamibiaNepalNetherlandsNew CaledoniaNew ZealandNicaraguaNigerNigeriaNorth AmericaNorwayOECD membersOmanOther small statesPacific island small statesPakistanPalauPanamaPapua New GuineaParaguayPeruPhilippinesPolandPortugalPost-demographic dividendPre-demographic dividendQatarRomaniaRussian FederationRwandaSamoaSao Tome and PrincipeSaudi ArabiaSenegalSerbiaSeychellesSierra LeoneSingaporeSint Maarten (Dutch part)Slovak RepublicSloveniaSmall statesSolomon IslandsSouth AfricaSouth AsiaSouth Asia (IDA & IBRD)South SudanSpainSri LankaSt. Kitts and NevisSt. LuciaSt. Vincent and the GrenadinesSub-Saharan Africa Sub-Saharan Africa (excluding high income)Sub-Saharan Africa (IDA & IBRD countries)SudanSurinameSwazilandSwedenSwitzerlandSyrian Arab RepublicTajikistanTanzaniaThailandTimor-LesteTogoTongaTrinidad and TobagoTunisiaTurkeyTuvaluUgandaUkraineUnited KingdomUnited StatesUpper middle incomeUruguayVanuatuVenezuela, RBVietnamWest Bank and GazaWorldYemen, Rep.ZambiaZimbabwe Timeline:
This timeline shows a graph from 1979 to 2013 of Gambia, The. No data until 1978. Number of actual observations by date: 30.
Source name:
World Development Indicators
Source organization:
International Monetary Fund, Balance of Payments Statistics Yearbook and data files.
Categories, topics:
Private Sector, Trade
Last updated:
apr 23, 2017
Indicators value changes by year
Minimum:
14.614 mln
jan 1, 1987
Maximum:
94.076 mln
jan 1, 2007
At the date of observation
Value
Absolute change
Change from previous value
jan 1, 1979
18.765 mln
+18.765 mln
0.0%
jan 1, 1980
22.23 mln
+3.465 mln
18.46%
jan 1, 1981
28.914 mln
+6.683 mln
30.06%
jan 1, 1982
23.787 mln
-5.127 mln
-17.73%
jan 1, 1983
22.599 mln
-1.188 mln
-5.0%
jan 1, 1984
20.742 mln
-1.856 mln
-8.21%
jan 1, 1985
19.944 mln
-798.382K
-3.85%
jan 1, 1986
19.187 mln
-757.329K
-3.8%
jan 1, 1987
14.614 mln
-4.573 mln
-23.83%
jan 1, 1988
29.519 mln
+14.905 mln
102.0%
jan 1, 1989
31.733 mln
+2.214 mln
7.5%
jan 1, 1990
31.866 mln
+132.965K
0.42%
jan 1, 1991
35.851 mln
+3.985 mln
12.5%
jan 1, 1992
49.6 mln
+13.749 mln
38.35%
jan 1, 1993
52.594 mln
+2.994 mln
6.04%
jan 1, 1994
53.45 mln
+856.608K
1.63%
jan 1, 1995
48.473 mln
-4.977 mln
-9.31%
jan 1, 1996
46.534 mln
-1.94 mln
-4.0%
jan 1, 1997
59.163 mln
+12.629 mln
27.14%
jan 1, 1998
58.218 mln
-945.306K
-1.6%
jan 1, 2004
30.25 mln
-27.967 mln
-48.04%
jan 1, 2005
44.732 mln
+14.482 mln
47.87%
jan 1, 2006
46.882 mln
+2.15 mln
4.81%
jan 1, 2007
94.076 mln
+47.193 mln
100.66%
jan 1, 2008
86.75 mln
-7.325 mln
-7.79%
jan 1, 2009
85.647 mln
-1.103 mln
-1.27%
jan 1, 2010
82.565 mln
-3.083 mln
-3.6%
jan 1, 2011
73.174 mln
-9.39 mln
-11.37%
jan 1, 2012
68.409 mln
-4.766 mln
-6.51%
jan 1, 2013
80.269 mln
+11.861 mln
17.34%
Ranking of countries by current statistics by years


Comments: