29
/
en
AIzaSyAYiBZKx7MnpbEhh9jyipgxe19OcubqV5w
April 1, 2024
161292
Italy
ITA
true
2
1
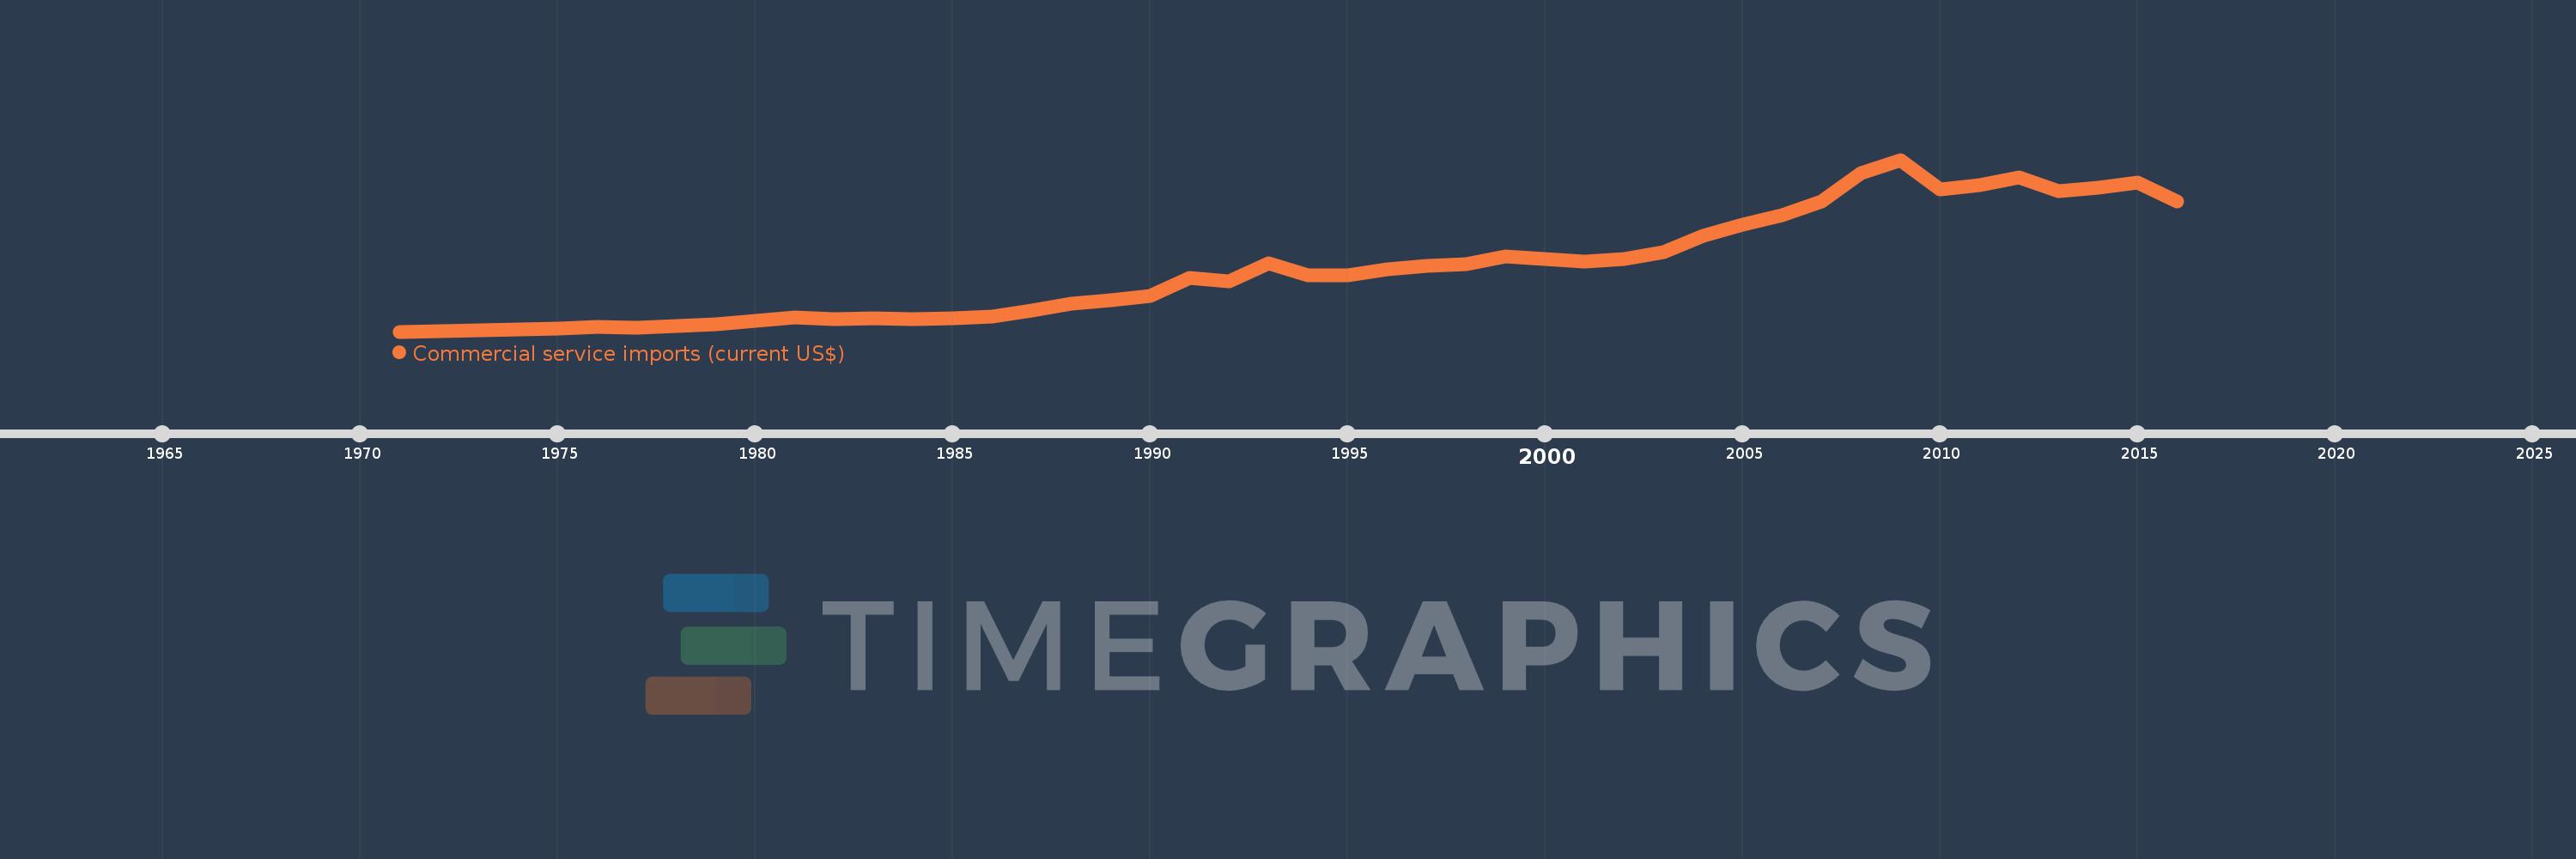
Commercial service imports (current US$)
2016,2015,2014,2013,2012,2011,2010,2009,2008,2007,2006,2005,2004,2003,2002,2001,2000,1999,1998,1997,1996,1995,1994,1993,1992,1991,1990,1989,1988,1987,1986,1985,1984,1983,1982,1981,1980,1979,1978,1977,1976,1975,1974,1973,1972,1971
This statistics in other country:
AfghanistanAlbaniaAlgeriaAngolaAntigua and BarbudaArab WorldArgentinaArmeniaArubaAustraliaAustriaAzerbaijanBahamas, TheBahrainBangladeshBarbadosBelarusBelgiumBelizeBeninBermudaBhutanBoliviaBosnia and HerzegovinaBotswanaBrazilBrunei DarussalamBulgariaBurkina FasoBurundiCabo VerdeCambodiaCameroonCanadaCaribbean small statesCentral African RepublicCentral Europe and the BalticsChadChileChinaColombiaComorosCongo, Dem. Rep.Congo, Rep.Costa RicaCote d'IvoireCroatiaCuracaoCyprusCzech RepublicDenmarkDjiboutiDominicaDominican RepublicEarly-demographic dividendEast Asia & PacificEast Asia & Pacific (excluding high income)East Asia & Pacific (IDA & IBRD countries)EcuadorEgypt, Arab Rep.El SalvadorEquatorial GuineaEritreaEstoniaEthiopiaEuro areaEurope & Central AsiaEurope & Central Asia (excluding high income)Europe & Central Asia (IDA & IBRD countries)European UnionFaroe IslandsFijiFinlandFragile and conflict affected situationsFranceFrench PolynesiaGabonGambia, TheGeorgiaGermanyGhanaGreeceGrenadaGuatemalaGuineaGuinea-BissauGuyanaHaitiHeavily indebted poor countries (HIPC)High incomeHondurasHong Kong SAR, ChinaHungaryIBRD onlyIcelandIDA & IBRD totalIDA blendIDA onlyIDA totalIndiaIndonesiaIran, Islamic Rep.IraqIrelandIsraelItalyJamaicaJapanJordanKazakhstanKenyaKiribatiKorea, Rep.KosovoKuwaitKyrgyz RepublicLao PDRLate-demographic dividendLatin America & Caribbean Latin America & Caribbean (excluding high income)Latin America & the Caribbean (IDA & IBRD countries)LatviaLeast developed countries: UN classificationLebanonLesothoLiberiaLibyaLithuaniaLow & middle incomeLow incomeLower middle incomeLuxembourgMacao SAR, ChinaMacedonia, FYRMadagascarMalawiMalaysiaMaldivesMaliMaltaMarshall IslandsMauritaniaMauritiusMexicoMicronesia, Fed. Sts.Middle East & North Africa (excluding high income)Middle East & North Africa (IDA & IBRD countries)Middle incomeMoldovaMongoliaMontenegroMoroccoMozambiqueMyanmarNamibiaNepalNetherlandsNew CaledoniaNew ZealandNicaraguaNigerNigeriaNorth AmericaNorwayOECD membersOmanOther small statesPacific island small statesPakistanPalauPanamaPapua New GuineaParaguayPeruPhilippinesPolandPortugalPost-demographic dividendPre-demographic dividendQatarRomaniaRussian FederationRwandaSamoaSao Tome and PrincipeSaudi ArabiaSenegalSerbiaSeychellesSierra LeoneSingaporeSint Maarten (Dutch part)Slovak RepublicSloveniaSmall statesSolomon IslandsSouth AfricaSouth AsiaSouth Asia (IDA & IBRD)South SudanSpainSri LankaSt. Kitts and NevisSt. LuciaSt. Vincent and the GrenadinesSub-Saharan Africa Sub-Saharan Africa (excluding high income)Sub-Saharan Africa (IDA & IBRD countries)SudanSurinameSwazilandSwedenSwitzerlandSyrian Arab RepublicTajikistanTanzaniaThailandTimor-LesteTogoTongaTrinidad and TobagoTunisiaTurkeyTuvaluUgandaUkraineUnited KingdomUnited StatesUpper middle incomeUruguayVanuatuVenezuela, RBVietnamWest Bank and GazaWorldYemen, Rep.ZambiaZimbabwe Timeline:
This timeline shows a graph from 1971 to 2016 of Italy. No data until 1970. Number of actual observations by date: 46.
Source name:
World Development Indicators
Source organization:
International Monetary Fund, Balance of Payments Statistics Yearbook and data files.
Categories, topics:
Private Sector, Trade
Last updated:
apr 23, 2017
Indicators value changes by year
Minimum:
3.406 bln
jan 1, 1971
Maximum:
129.596 bln
jan 1, 2009
At the date of observation
Value
Absolute change
Change from previous value
jan 1, 1971
3.406 bln
+3.406 bln
0.0%
jan 1, 1972
3.632 bln
+225.819 mln
6.63%
jan 1, 1973
4.134 bln
+501.545 mln
13.81%
jan 1, 1974
5.202 bln
+1.068 bln
25.83%
jan 1, 1975
5.844 bln
+642.921 mln
12.36%
jan 1, 1976
6.699 bln
+854.751 mln
14.63%
jan 1, 1977
6.072 bln
-627.227 mln
-9.36%
jan 1, 1978
7.451 bln
+1.379 bln
22.71%
jan 1, 1979
8.93 bln
+1.479 bln
19.85%
jan 1, 1980
11.241 bln
+2.311 bln
25.88%
jan 1, 1981
14.073 bln
+2.832 bln
25.19%
jan 1, 1982
12.724 bln
-1.35 bln
-9.59%
jan 1, 1983
13.134 bln
+409.987 mln
3.22%
jan 1, 1984
12.617 bln
-516.754 mln
-3.93%
jan 1, 1985
13.373 bln
+755.753 mln
5.99%
jan 1, 1986
14.624 bln
+1.252 bln
9.36%
jan 1, 1987
18.859 bln
+4.235 bln
28.96%
jan 1, 1988
24.204 bln
+5.345 bln
28.34%
jan 1, 1989
26.431 bln
+2.227 bln
9.2%
jan 1, 1990
29.605 bln
+3.174 bln
12.01%
jan 1, 1991
43.137 bln
+13.532 bln
45.71%
jan 1, 1992
40.549 bln
-2.588 bln
-6.0%
jan 1, 1993
53.83 bln
+13.281 bln
32.75%
jan 1, 1994
44.931 bln
-8.898 bln
-16.53%
jan 1, 1995
44.718 bln
-213.252 mln
-0.47%
jan 1, 1996
49.108 bln
+4.39 bln
9.82%
jan 1, 1997
51.423 bln
+2.315 bln
4.71%
jan 1, 1998
53.22 bln
+1.796 bln
3.49%
jan 1, 1999
58.458 bln
+5.238 bln
9.84%
jan 1, 2000
56.604 bln
-1.854 bln
-3.17%
jan 1, 2001
55.102 bln
-1.501 bln
-2.65%
jan 1, 2002
56.485 bln
+1.383 bln
2.51%
jan 1, 2003
61.734 bln
+5.249 bln
9.29%
jan 1, 2004
73.447 bln
+11.713 bln
18.97%
jan 1, 2005
82.025 bln
+8.578 bln
11.68%
jan 1, 2006
88.827 bln
+6.802 bln
8.29%
jan 1, 2007
98.831 bln
+10.004 bln
11.26%
jan 1, 2008
119.817 bln
+20.986 bln
21.23%
jan 1, 2009
129.596 bln
+9.78 bln
8.16%
jan 1, 2010
107.711 bln
-21.886 bln
-16.89%
jan 1, 2011
110.907 bln
+3.197 bln
2.97%
jan 1, 2012
116.657 bln
+5.75 bln
5.18%
jan 1, 2013
106.332 bln
-10.325 bln
-8.85%
jan 1, 2014
109.093 bln
+2.761 bln
2.6%
jan 1, 2015
113.043 bln
+3.95 bln
3.62%
jan 1, 2016
98.79 bln
-14.253 bln
-12.61%
Ranking of countries by current statistics by years


Comments: