29
/
en
AIzaSyAYiBZKx7MnpbEhh9jyipgxe19OcubqV5w
April 1, 2024
90909
Brazil
BRA
true
2
1
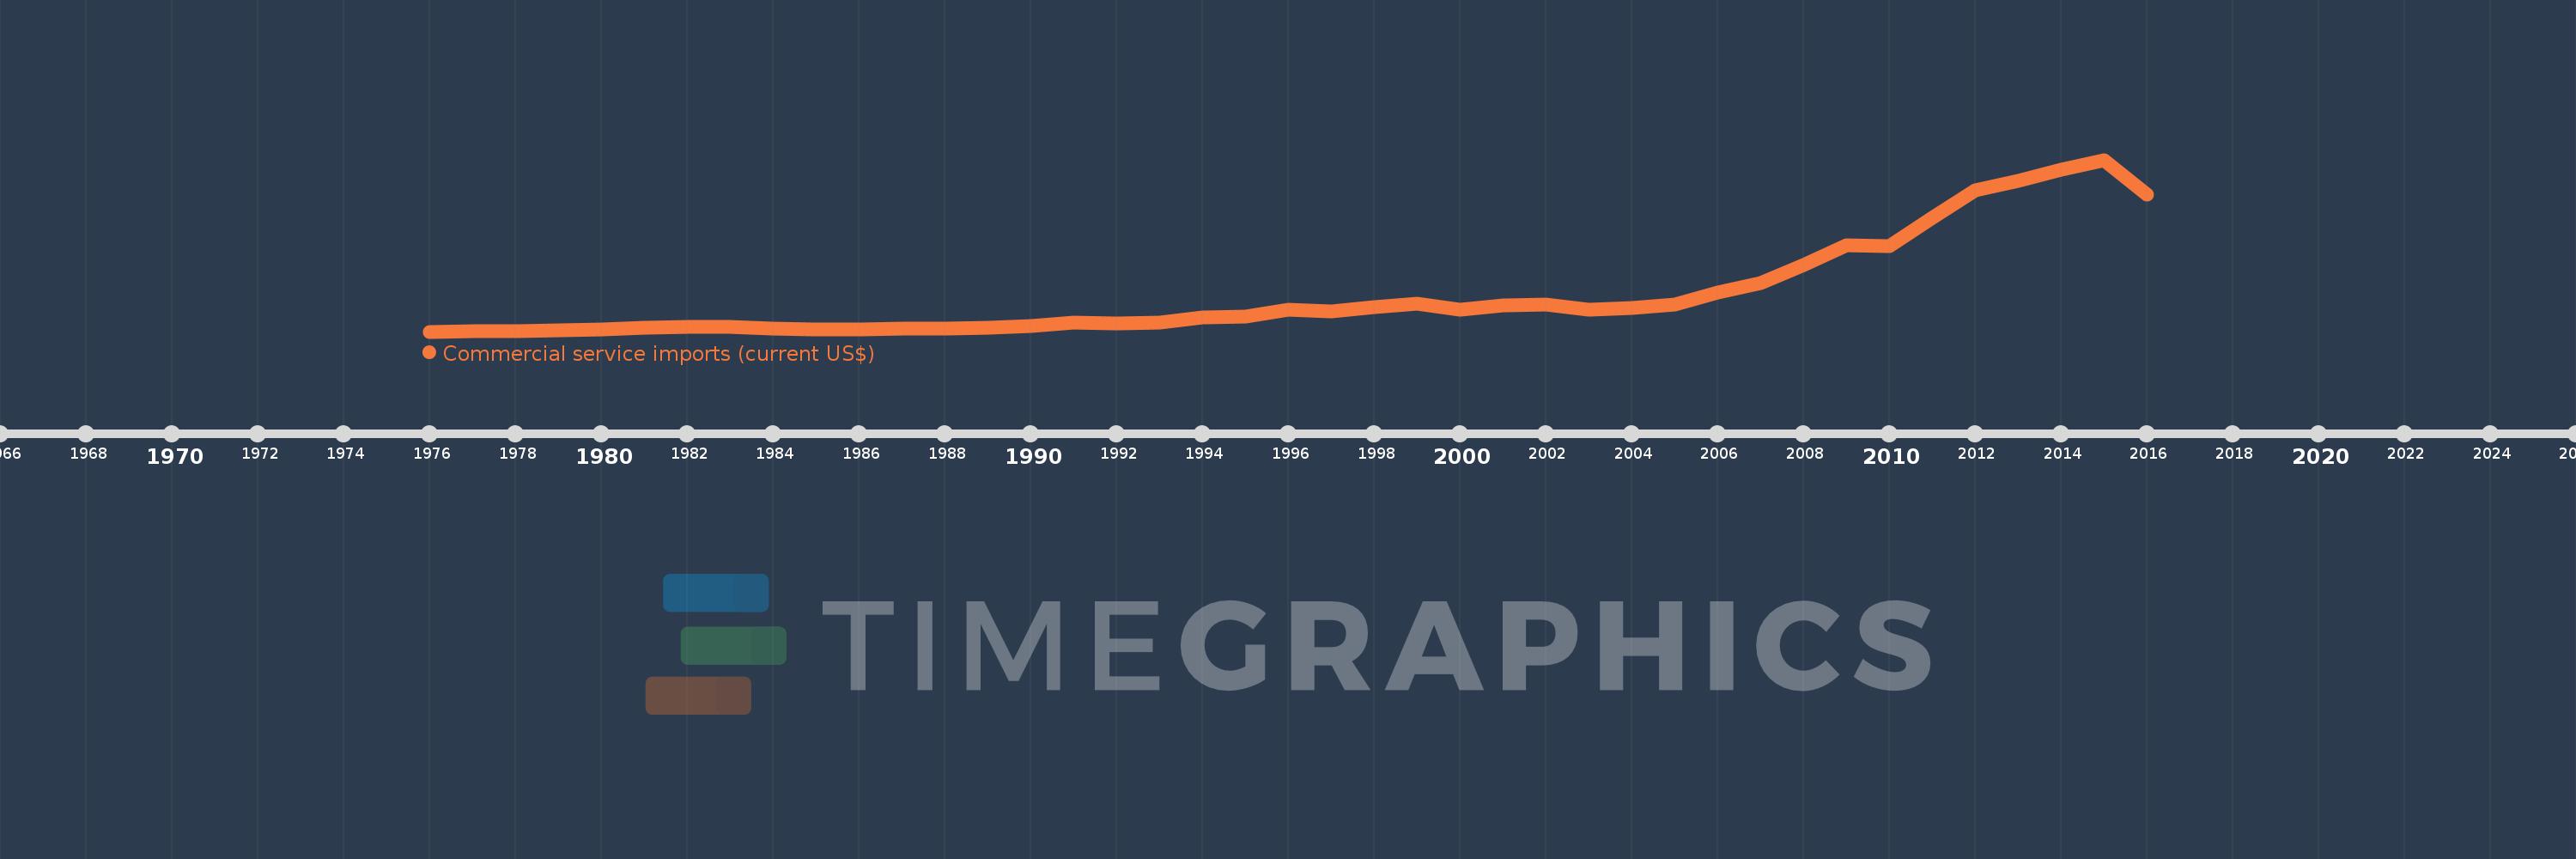
Commercial service imports (current US$)
2016,2015,2014,2013,2012,2011,2010,2009,2008,2007,2006,2005,2004,2003,2002,2001,2000,1999,1998,1997,1996,1995,1994,1993,1992,1991,1990,1989,1988,1987,1986,1985,1984,1983,1982,1981,1980,1979,1978,1977,1976
This statistics in other country:
AfghanistanAlbaniaAlgeriaAngolaAntigua and BarbudaArab WorldArgentinaArmeniaArubaAustraliaAustriaAzerbaijanBahamas, TheBahrainBangladeshBarbadosBelarusBelgiumBelizeBeninBermudaBhutanBoliviaBosnia and HerzegovinaBotswanaBrazilBrunei DarussalamBulgariaBurkina FasoBurundiCabo VerdeCambodiaCameroonCanadaCaribbean small statesCentral African RepublicCentral Europe and the BalticsChadChileChinaColombiaComorosCongo, Dem. Rep.Congo, Rep.Costa RicaCote d'IvoireCroatiaCuracaoCyprusCzech RepublicDenmarkDjiboutiDominicaDominican RepublicEarly-demographic dividendEast Asia & PacificEast Asia & Pacific (excluding high income)East Asia & Pacific (IDA & IBRD countries)EcuadorEgypt, Arab Rep.El SalvadorEquatorial GuineaEritreaEstoniaEthiopiaEuro areaEurope & Central AsiaEurope & Central Asia (excluding high income)Europe & Central Asia (IDA & IBRD countries)European UnionFaroe IslandsFijiFinlandFragile and conflict affected situationsFranceFrench PolynesiaGabonGambia, TheGeorgiaGermanyGhanaGreeceGrenadaGuatemalaGuineaGuinea-BissauGuyanaHaitiHeavily indebted poor countries (HIPC)High incomeHondurasHong Kong SAR, ChinaHungaryIBRD onlyIcelandIDA & IBRD totalIDA blendIDA onlyIDA totalIndiaIndonesiaIran, Islamic Rep.IraqIrelandIsraelItalyJamaicaJapanJordanKazakhstanKenyaKiribatiKorea, Rep.KosovoKuwaitKyrgyz RepublicLao PDRLate-demographic dividendLatin America & Caribbean Latin America & Caribbean (excluding high income)Latin America & the Caribbean (IDA & IBRD countries)LatviaLeast developed countries: UN classificationLebanonLesothoLiberiaLibyaLithuaniaLow & middle incomeLow incomeLower middle incomeLuxembourgMacao SAR, ChinaMacedonia, FYRMadagascarMalawiMalaysiaMaldivesMaliMaltaMarshall IslandsMauritaniaMauritiusMexicoMicronesia, Fed. Sts.Middle East & North Africa (excluding high income)Middle East & North Africa (IDA & IBRD countries)Middle incomeMoldovaMongoliaMontenegroMoroccoMozambiqueMyanmarNamibiaNepalNetherlandsNew CaledoniaNew ZealandNicaraguaNigerNigeriaNorth AmericaNorwayOECD membersOmanOther small statesPacific island small statesPakistanPalauPanamaPapua New GuineaParaguayPeruPhilippinesPolandPortugalPost-demographic dividendPre-demographic dividendQatarRomaniaRussian FederationRwandaSamoaSao Tome and PrincipeSaudi ArabiaSenegalSerbiaSeychellesSierra LeoneSingaporeSint Maarten (Dutch part)Slovak RepublicSloveniaSmall statesSolomon IslandsSouth AfricaSouth AsiaSouth Asia (IDA & IBRD)South SudanSpainSri LankaSt. Kitts and NevisSt. LuciaSt. Vincent and the GrenadinesSub-Saharan Africa Sub-Saharan Africa (excluding high income)Sub-Saharan Africa (IDA & IBRD countries)SudanSurinameSwazilandSwedenSwitzerlandSyrian Arab RepublicTajikistanTanzaniaThailandTimor-LesteTogoTongaTrinidad and TobagoTunisiaTurkeyTuvaluUgandaUkraineUnited KingdomUnited StatesUpper middle incomeUruguayVanuatuVenezuela, RBVietnamWest Bank and GazaWorldYemen, Rep.ZambiaZimbabwe Timeline:
This timeline shows a graph from 1976 to 2016 of Brazil. No data until 1975. Number of actual observations by date: 41.
Source name:
World Development Indicators
Source organization:
International Monetary Fund, Balance of Payments Statistics Yearbook and data files.
Categories, topics:
Private Sector, Trade
Last updated:
apr 23, 2017
Indicators value changes by year
Minimum:
2.388 bln
jan 1, 1976
Maximum:
85.916 bln
jan 1, 2015
At the date of observation
Value
Absolute change
Change from previous value
jan 1, 1976
2.388 bln
+2.388 bln
0.0%
jan 1, 1977
2.486 bln
+98.0 mln
4.1%
jan 1, 1978
2.674 bln
+188.0 mln
7.56%
jan 1, 1979
2.95 bln
+276.0 mln
10.32%
jan 1, 1980
3.356 bln
+406.0 mln
13.76%
jan 1, 1981
4.442 bln
+1.086 bln
32.36%
jan 1, 1982
4.63 bln
+188.0 mln
4.23%
jan 1, 1983
4.872 bln
+242.0 mln
5.23%
jan 1, 1984
3.734 bln
-1.138 bln
-23.36%
jan 1, 1985
3.279 bln
-455.0 mln
-12.19%
jan 1, 1986
3.413 bln
+134.0 mln
4.09%
jan 1, 1987
4.032 bln
+619.0 mln
18.14%
jan 1, 1988
3.665 bln
-367.0 mln
-9.1%
jan 1, 1989
4.405 bln
+740.0 mln
20.19%
jan 1, 1990
5.092 bln
+687.0 mln
15.6%
jan 1, 1991
6.733 bln
+1.641 bln
32.23%
jan 1, 1992
6.381 bln
-352.0 mln
-5.23%
jan 1, 1993
6.609 bln
+228.0 mln
3.57%
jan 1, 1994
9.156 bln
+2.547 bln
38.54%
jan 1, 1995
9.836 bln
+680.0 mln
7.43%
jan 1, 1996
13.161 bln
+3.325 bln
33.8%
jan 1, 1997
12.203 bln
-958.0 mln
-7.28%
jan 1, 1998
14.45 bln
+2.247 bln
18.41%
jan 1, 1999
15.771 bln
+1.321 bln
9.14%
jan 1, 2000
12.983 bln
-2.788 bln
-17.68%
jan 1, 2001
15.179 bln
+2.196 bln
16.91%
jan 1, 2002
15.389 bln
+210.733 mln
1.39%
jan 1, 2003
13.062 bln
-2.327 bln
-15.12%
jan 1, 2004
13.87 bln
+807.687 mln
6.18%
jan 1, 2005
15.498 bln
+1.628 bln
11.74%
jan 1, 2006
21.524 bln
+6.026 bln
38.88%
jan 1, 2007
26.183 bln
+4.659 bln
21.64%
jan 1, 2008
34.7 bln
+8.517 bln
32.53%
jan 1, 2009
44.396 bln
+9.697 bln
27.94%
jan 1, 2010
44.075 bln
-321.425 mln
-0.72%
jan 1, 2011
57.813 bln
+13.738 bln
31.17%
jan 1, 2012
70.984 bln
+13.172 bln
22.78%
jan 1, 2013
75.832 bln
+4.848 bln
6.83%
jan 1, 2014
81.053 bln
+5.221 bln
6.89%
jan 1, 2015
85.916 bln
+4.862 bln
6.0%
jan 1, 2016
68.862 bln
-17.053 bln
-19.85%
Ranking of countries by current statistics by years


Comments: