29
/
en
AIzaSyAYiBZKx7MnpbEhh9jyipgxe19OcubqV5w
April 1, 2024
73690
Austria
AUT
true
2
1
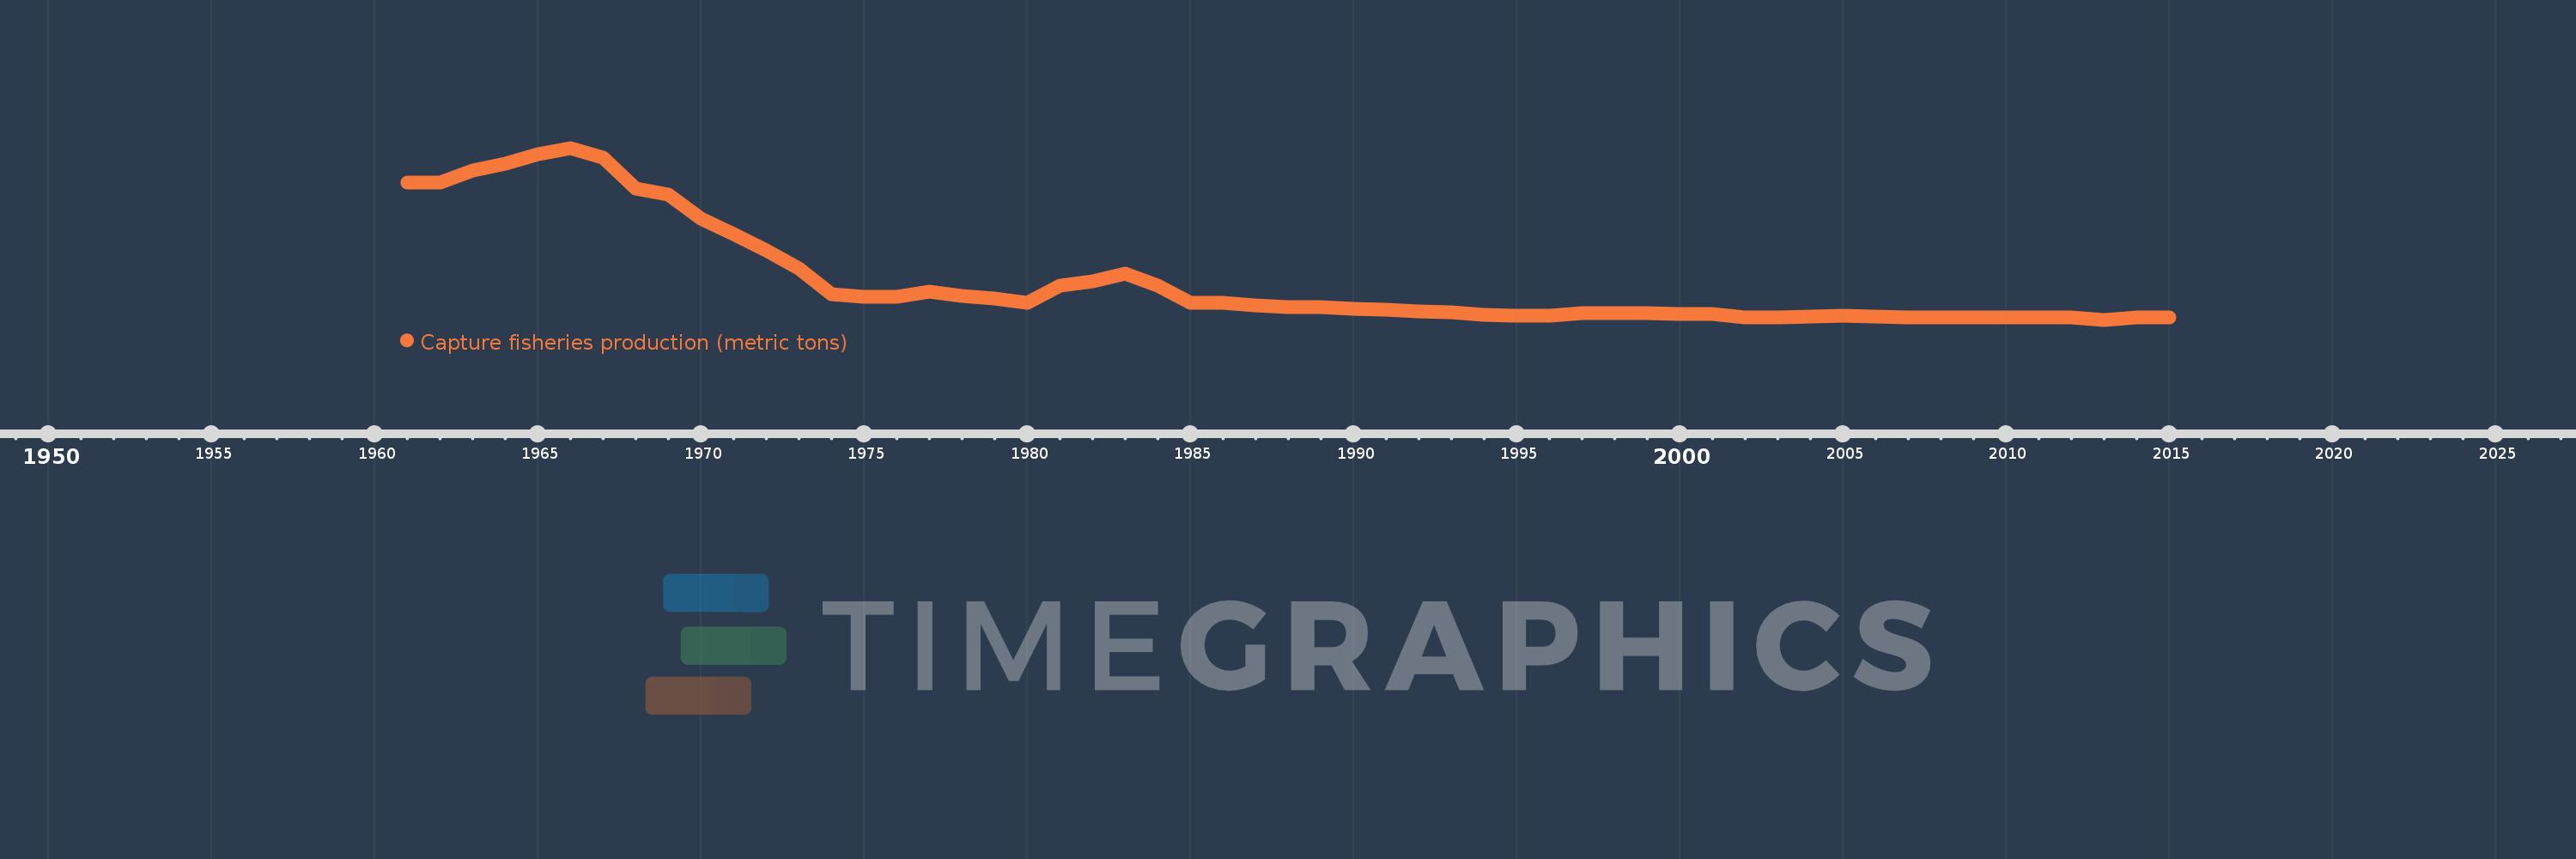
Capture fisheries production (metric tons)
2015,2014,2013,2012,2011,2010,2009,2008,2007,2006,2005,2004,2003,2002,2001,2000,1999,1998,1997,1996,1995,1994,1993,1992,1991,1990,1989,1988,1987,1986,1985,1984,1983,1982,1981,1980,1979,1978,1977,1976,1975,1974,1973,1972,1971,1970,1969,1968,1967,1966,1965,1964,1963,1962,1961
This statistics in other country:
AfghanistanAlbaniaAlgeriaAmerican SamoaAngolaAntigua and BarbudaArab WorldArgentinaArmeniaArubaAustraliaAustriaAzerbaijanBahamas, TheBahrainBangladeshBarbadosBelarusBelgiumBelizeBeninBermudaBhutanBoliviaBosnia and HerzegovinaBotswanaBrazilBritish Virgin IslandsBrunei DarussalamBulgariaBurkina FasoBurundiCabo VerdeCambodiaCameroonCanadaCaribbean small statesCayman IslandsCentral African RepublicCentral Europe and the BalticsChadChannel IslandsChileChinaColombiaComorosCongo, Dem. Rep.Congo, Rep.Costa RicaCote d'IvoireCroatiaCubaCuracaoCyprusCzech RepublicDenmarkDjiboutiDominicaDominican RepublicEarly-demographic dividendEast Asia & PacificEast Asia & Pacific (excluding high income)East Asia & Pacific (IDA & IBRD countries)EcuadorEgypt, Arab Rep.El SalvadorEquatorial GuineaEritreaEstoniaEthiopiaEuro areaEurope & Central AsiaEurope & Central Asia (excluding high income)Europe & Central Asia (IDA & IBRD countries)European UnionFaroe IslandsFijiFinlandFragile and conflict affected situationsFranceFrench PolynesiaGabonGambia, TheGeorgiaGermanyGhanaGreeceGreenlandGrenadaGuamGuatemalaGuineaGuinea-BissauGuyanaHaitiHeavily indebted poor countries (HIPC)High incomeHondurasHong Kong SAR, ChinaHungaryIBRD onlyIcelandIDA & IBRD totalIDA blendIDA onlyIDA totalIndiaIndonesiaIran, Islamic Rep.IraqIrelandIsle of ManIsraelItalyJamaicaJapanJordanKazakhstanKenyaKiribatiKorea, Dem. People’s Rep.Korea, Rep.KuwaitKyrgyz RepublicLao PDRLate-demographic dividendLatin America & Caribbean Latin America & Caribbean (excluding high income)Latin America & the Caribbean (IDA & IBRD countries)LatviaLeast developed countries: UN classificationLebanonLesothoLiberiaLibyaLithuaniaLow & middle incomeLow incomeLower middle incomeMacao SAR, ChinaMacedonia, FYRMadagascarMalawiMalaysiaMaldivesMaliMaltaMarshall IslandsMauritaniaMauritiusMexicoMicronesia, Fed. Sts.Middle East & North AfricaMiddle East & North Africa (excluding high income)Middle East & North Africa (IDA & IBRD countries)Middle incomeMoldovaMonacoMongoliaMontenegroMoroccoMozambiqueMyanmarNamibiaNauruNepalNetherlandsNew CaledoniaNew ZealandNicaraguaNigerNigeriaNorth AmericaNorthern Mariana IslandsNorwayOECD membersOmanOther small statesPacific island small statesPakistanPalauPanamaPapua New GuineaParaguayPeruPhilippinesPolandPortugalPost-demographic dividendPre-demographic dividendPuerto RicoQatarRomaniaRussian FederationRwandaSamoaSao Tome and PrincipeSaudi ArabiaSenegalSerbiaSeychellesSierra LeoneSingaporeSint Maarten (Dutch part)Slovak RepublicSloveniaSmall statesSolomon IslandsSomaliaSouth AfricaSouth AsiaSouth Asia (IDA & IBRD)South SudanSpainSri LankaSt. Kitts and NevisSt. LuciaSt. Martin (French part)St. Vincent and the GrenadinesSub-Saharan Africa Sub-Saharan Africa (excluding high income)Sub-Saharan Africa (IDA & IBRD countries)SudanSurinameSwazilandSwedenSwitzerlandSyrian Arab RepublicTajikistanTanzaniaThailandTimor-LesteTogoTongaTrinidad and TobagoTunisiaTurkeyTurkmenistanTurks and Caicos IslandsTuvaluUgandaUkraineUnited Arab EmiratesUnited KingdomUnited StatesUpper middle incomeUruguayUzbekistanVanuatuVenezuela, RBVietnamVirgin Islands (U.S.)West Bank and GazaWorldYemen, Rep.ZambiaZimbabwe Timeline:
This timeline shows a graph from 1961 to 2015 of Austria. No data until 1960. Number of actual observations by date: 55.
Source name:
World Development Indicators
Source organization:
Food and Agriculture Organization.
Categories, topics:
Environment
Last updated:
apr 23, 2017
Indicators value changes by year
At the date of observation
Value
Absolute change
Change from previous value
jan 1, 1961
3.55K
+3.55K
0.0%
jan 1, 1962
3.54K
-10.0
-0.28%
jan 1, 1963
3.83K
+290.0
8.19%
jan 1, 1964
4.0K
+170.0
4.44%
jan 1, 1965
4.22K
+220.0
5.5%
jan 1, 1966
4.37K
+150.0
3.55%
jan 1, 1967
4.15K
-220.0
-5.03%
jan 1, 1968
3.41K
-740.0
-17.83%
jan 1, 1969
3.26K
-150.0
-4.4%
jan 1, 1970
2.7K
-560.0
-17.18%
jan 1, 1971
2.33K
-370.0
-13.7%
jan 1, 1972
1.94K
-390.0
-16.74%
jan 1, 1973
1.52K
-420.0
-21.65%
jan 1, 1974
900.0
-620.0
-40.79%
jan 1, 1975
850.0
-50.0
-5.56%
jan 1, 1976
840.0
-10.0
-1.18%
jan 1, 1977
970.0
+130.0
15.48%
jan 1, 1978
870.0
-100.0
-10.31%
jan 1, 1979
800.0
-70.0
-8.05%
jan 1, 1980
700.0
-100.0
-12.5%
jan 1, 1981
1.1K
+400.0
57.14%
jan 1, 1982
1.2K
+100.0
9.09%
jan 1, 1983
1.4K
+200.0
16.67%
jan 1, 1984
1.1K
-300.0
-21.43%
jan 1, 1985
700.0
-400.0
-36.36%
jan 1, 1986
700.0
0.0
0.0%
jan 1, 1987
640.0
-60.0
-8.57%
jan 1, 1988
600.0
-40.0
-6.25%
jan 1, 1989
600.0
0.0
0.0%
jan 1, 1990
550.0
-50.0
-8.33%
jan 1, 1991
533.0
-17.0
-3.09%
jan 1, 1992
500.0
-33.0
-6.19%
jan 1, 1993
479.0
-21.0
-4.2%
jan 1, 1994
420.0
-59.0
-12.32%
jan 1, 1995
388.0
-32.0
-7.62%
jan 1, 1996
404.0
+16.0
4.12%
jan 1, 1997
450.0
+46.0
11.39%
jan 1, 1998
465.0
+15.0
3.33%
jan 1, 1999
451.0
-14.0
-3.01%
jan 1, 2000
432.0
-19.0
-4.21%
jan 1, 2001
439.0
+7.0
1.62%
jan 1, 2002
362.0
-77.0
-17.54%
jan 1, 2003
350.0
-12.0
-3.31%
jan 1, 2004
372.0
+22.0
6.29%
jan 1, 2005
400.0
+28.0
7.53%
jan 1, 2006
370.0
-30.0
-7.5%
jan 1, 2007
360.0
-10.0
-2.7%
jan 1, 2008
350.0
-10.0
-2.78%
jan 1, 2009
350.0
0.0
0.0%
jan 1, 2010
350.0
0.0
0.0%
jan 1, 2011
350.0
0.0
0.0%
jan 1, 2012
350.0
0.0
0.0%
jan 1, 2013
300.0
-50.0
-14.29%
jan 1, 2014
350.0
+50.0
16.67%
jan 1, 2015
350.0
0.0
0.0%
Ranking of countries by current statistics by years


Comments: