29
/
en
AIzaSyAYiBZKx7MnpbEhh9jyipgxe19OcubqV5w
April 1, 2024
223243
Philippines
PHL
true
2
1
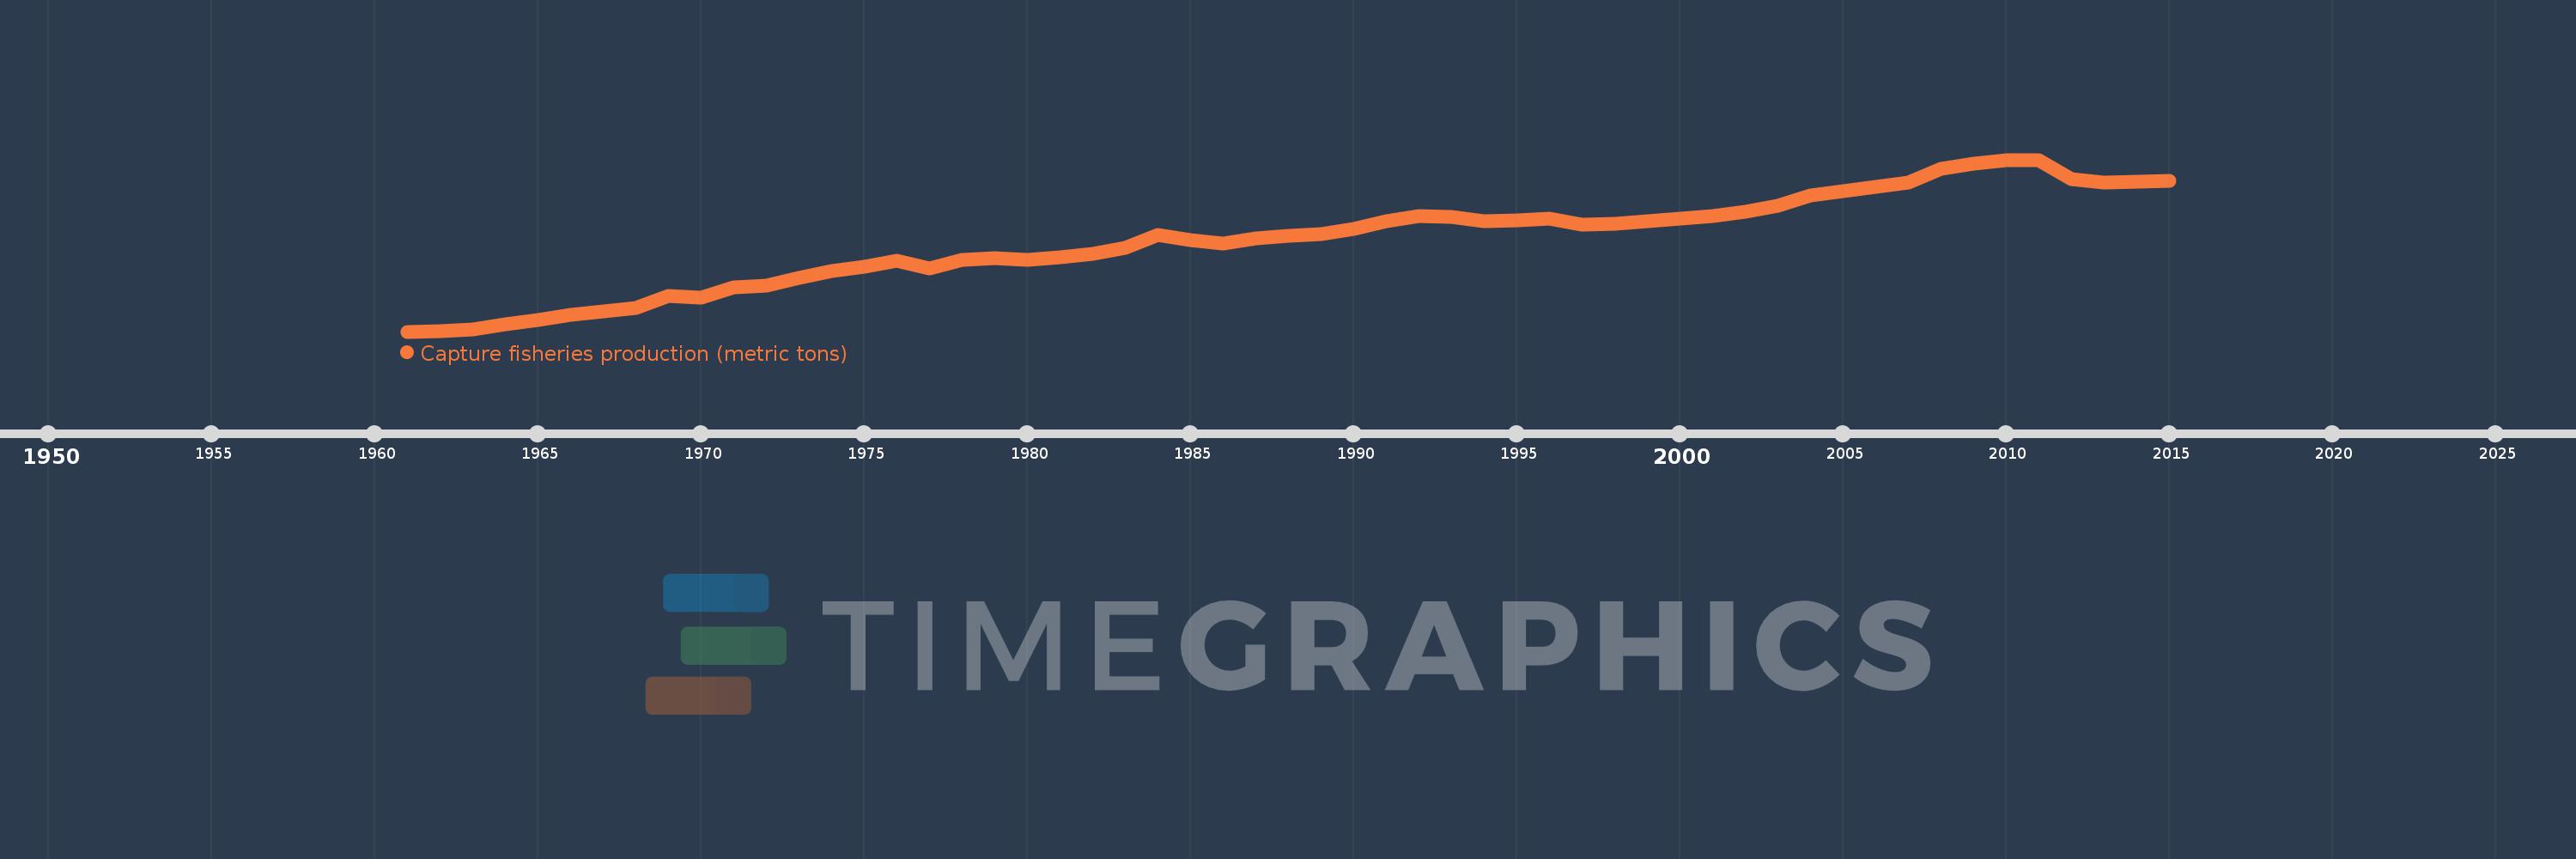
Capture fisheries production (metric tons)
2015,2014,2013,2012,2011,2010,2009,2008,2007,2006,2005,2004,2003,2002,2001,2000,1999,1998,1997,1996,1995,1994,1993,1992,1991,1990,1989,1988,1987,1986,1985,1984,1983,1982,1981,1980,1979,1978,1977,1976,1975,1974,1973,1972,1971,1970,1969,1968,1967,1966,1965,1964,1963,1962,1961
This statistics in other country:
AfghanistanAlbaniaAlgeriaAmerican SamoaAngolaAntigua and BarbudaArab WorldArgentinaArmeniaArubaAustraliaAustriaAzerbaijanBahamas, TheBahrainBangladeshBarbadosBelarusBelgiumBelizeBeninBermudaBhutanBoliviaBosnia and HerzegovinaBotswanaBrazilBritish Virgin IslandsBrunei DarussalamBulgariaBurkina FasoBurundiCabo VerdeCambodiaCameroonCanadaCaribbean small statesCayman IslandsCentral African RepublicCentral Europe and the BalticsChadChannel IslandsChileChinaColombiaComorosCongo, Dem. Rep.Congo, Rep.Costa RicaCote d'IvoireCroatiaCubaCuracaoCyprusCzech RepublicDenmarkDjiboutiDominicaDominican RepublicEarly-demographic dividendEast Asia & PacificEast Asia & Pacific (excluding high income)East Asia & Pacific (IDA & IBRD countries)EcuadorEgypt, Arab Rep.El SalvadorEquatorial GuineaEritreaEstoniaEthiopiaEuro areaEurope & Central AsiaEurope & Central Asia (excluding high income)Europe & Central Asia (IDA & IBRD countries)European UnionFaroe IslandsFijiFinlandFragile and conflict affected situationsFranceFrench PolynesiaGabonGambia, TheGeorgiaGermanyGhanaGreeceGreenlandGrenadaGuamGuatemalaGuineaGuinea-BissauGuyanaHaitiHeavily indebted poor countries (HIPC)High incomeHondurasHong Kong SAR, ChinaHungaryIBRD onlyIcelandIDA & IBRD totalIDA blendIDA onlyIDA totalIndiaIndonesiaIran, Islamic Rep.IraqIrelandIsle of ManIsraelItalyJamaicaJapanJordanKazakhstanKenyaKiribatiKorea, Dem. People’s Rep.Korea, Rep.KuwaitKyrgyz RepublicLao PDRLate-demographic dividendLatin America & Caribbean Latin America & Caribbean (excluding high income)Latin America & the Caribbean (IDA & IBRD countries)LatviaLeast developed countries: UN classificationLebanonLesothoLiberiaLibyaLithuaniaLow & middle incomeLow incomeLower middle incomeMacao SAR, ChinaMacedonia, FYRMadagascarMalawiMalaysiaMaldivesMaliMaltaMarshall IslandsMauritaniaMauritiusMexicoMicronesia, Fed. Sts.Middle East & North AfricaMiddle East & North Africa (excluding high income)Middle East & North Africa (IDA & IBRD countries)Middle incomeMoldovaMonacoMongoliaMontenegroMoroccoMozambiqueMyanmarNamibiaNauruNepalNetherlandsNew CaledoniaNew ZealandNicaraguaNigerNigeriaNorth AmericaNorthern Mariana IslandsNorwayOECD membersOmanOther small statesPacific island small statesPakistanPalauPanamaPapua New GuineaParaguayPeruPhilippinesPolandPortugalPost-demographic dividendPre-demographic dividendPuerto RicoQatarRomaniaRussian FederationRwandaSamoaSao Tome and PrincipeSaudi ArabiaSenegalSerbiaSeychellesSierra LeoneSingaporeSint Maarten (Dutch part)Slovak RepublicSloveniaSmall statesSolomon IslandsSomaliaSouth AfricaSouth AsiaSouth Asia (IDA & IBRD)South SudanSpainSri LankaSt. Kitts and NevisSt. LuciaSt. Martin (French part)St. Vincent and the GrenadinesSub-Saharan Africa Sub-Saharan Africa (excluding high income)Sub-Saharan Africa (IDA & IBRD countries)SudanSurinameSwazilandSwedenSwitzerlandSyrian Arab RepublicTajikistanTanzaniaThailandTimor-LesteTogoTongaTrinidad and TobagoTunisiaTurkeyTurkmenistanTurks and Caicos IslandsTuvaluUgandaUkraineUnited Arab EmiratesUnited KingdomUnited StatesUpper middle incomeUruguayUzbekistanVanuatuVenezuela, RBVietnamVirgin Islands (U.S.)West Bank and GazaWorldYemen, Rep.ZambiaZimbabwe Timeline:
This timeline shows a graph from 1961 to 2015 of Philippines. No data until 1960. Number of actual observations by date: 55.
Source name:
World Development Indicators
Source organization:
Food and Agriculture Organization.
Categories, topics:
Environment
Last updated:
apr 23, 2017
Indicators value changes by year
Minimum:
438.468K
jan 1, 1961
Maximum:
2.616 mln
jan 1, 2011
At the date of observation
Value
Absolute change
Change from previous value
jan 1, 1961
438.468K
+438.468K
0.0%
jan 1, 1962
438.472K
+4.0
0.0%
jan 1, 1963
468.347K
+29.875K
6.81%
jan 1, 1964
529.446K
+61.099K
13.05%
jan 1, 1965
583.591K
+54.145K
10.23%
jan 1, 1966
651.125K
+67.534K
11.57%
jan 1, 1967
695.754K
+44.629K
6.85%
jan 1, 1968
738.783K
+43.029K
6.18%
jan 1, 1969
887.119K
+148.336K
20.08%
jan 1, 1970
866.669K
-20.45K
-2.31%
jan 1, 1971
1.003 mln
+136.596K
15.76%
jan 1, 1972
1.02 mln
+16.628K
1.66%
jan 1, 1973
1.123 mln
+103.211K
10.12%
jan 1, 1974
1.206 mln
+82.695K
7.36%
jan 1, 1975
1.263 mln
+57.218K
4.75%
jan 1, 1976
1.34 mln
+77.09K
6.1%
jan 1, 1977
1.238 mln
-102.323K
-7.64%
jan 1, 1978
1.347 mln
+109.188K
8.82%
jan 1, 1979
1.369 mln
+21.866K
1.62%
jan 1, 1980
1.349 mln
-19.572K
-1.43%
jan 1, 1981
1.385 mln
+35.684K
2.64%
jan 1, 1982
1.428 mln
+42.792K
3.09%
jan 1, 1983
1.497 mln
+69.394K
4.86%
jan 1, 1984
1.667 mln
+169.935K
11.35%
jan 1, 1985
1.603 mln
-63.906K
-3.83%
jan 1, 1986
1.56 mln
-43.616K
-2.72%
jan 1, 1987
1.621 mln
+61.065K
3.92%
jan 1, 1988
1.653 mln
+32.852K
2.03%
jan 1, 1989
1.671 mln
+17.718K
1.07%
jan 1, 1990
1.743 mln
+71.53K
4.28%
jan 1, 1991
1.834 mln
+91.124K
5.23%
jan 1, 1992
1.907 mln
+73.595K
4.01%
jan 1, 1993
1.89 mln
-17.503K
-0.92%
jan 1, 1994
1.839 mln
-50.894K
-2.69%
jan 1, 1995
1.853 mln
+14.065K
0.76%
jan 1, 1996
1.866 mln
+13.114K
0.71%
jan 1, 1997
1.789 mln
-77.174K
-4.14%
jan 1, 1998
1.81 mln
+20.631K
1.15%
jan 1, 1999
1.836 mln
+26.315K
1.45%
jan 1, 2000
1.874 mln
+38.222K
2.08%
jan 1, 2001
1.899 mln
+24.735K
1.32%
jan 1, 2002
1.952 mln
+53.159K
2.8%
jan 1, 2003
2.034 mln
+81.423K
4.17%
jan 1, 2004
2.169 mln
+135.694K
6.67%
jan 1, 2005
2.215 mln
+45.35K
2.09%
jan 1, 2006
2.273 mln
+58.014K
2.62%
jan 1, 2007
2.322 mln
+49.588K
2.18%
jan 1, 2008
2.503 mln
+180.573K
7.78%
jan 1, 2009
2.565 mln
+62.016K
2.48%
jan 1, 2010
2.606 mln
+41.114K
1.6%
jan 1, 2011
2.616 mln
+9.927K
0.38%
jan 1, 2012
2.367 mln
-248.563K
-9.5%
jan 1, 2013
2.327 mln
-40.43K
-1.71%
jan 1, 2014
2.335 mln
+8.596K
0.37%
jan 1, 2015
2.354 mln
+18.963K
0.81%
Ranking of countries by current statistics by years


Comments: