29
/
en
AIzaSyAYiBZKx7MnpbEhh9jyipgxe19OcubqV5w
April 1, 2024
29689
Euro area
EMU
false
2
1
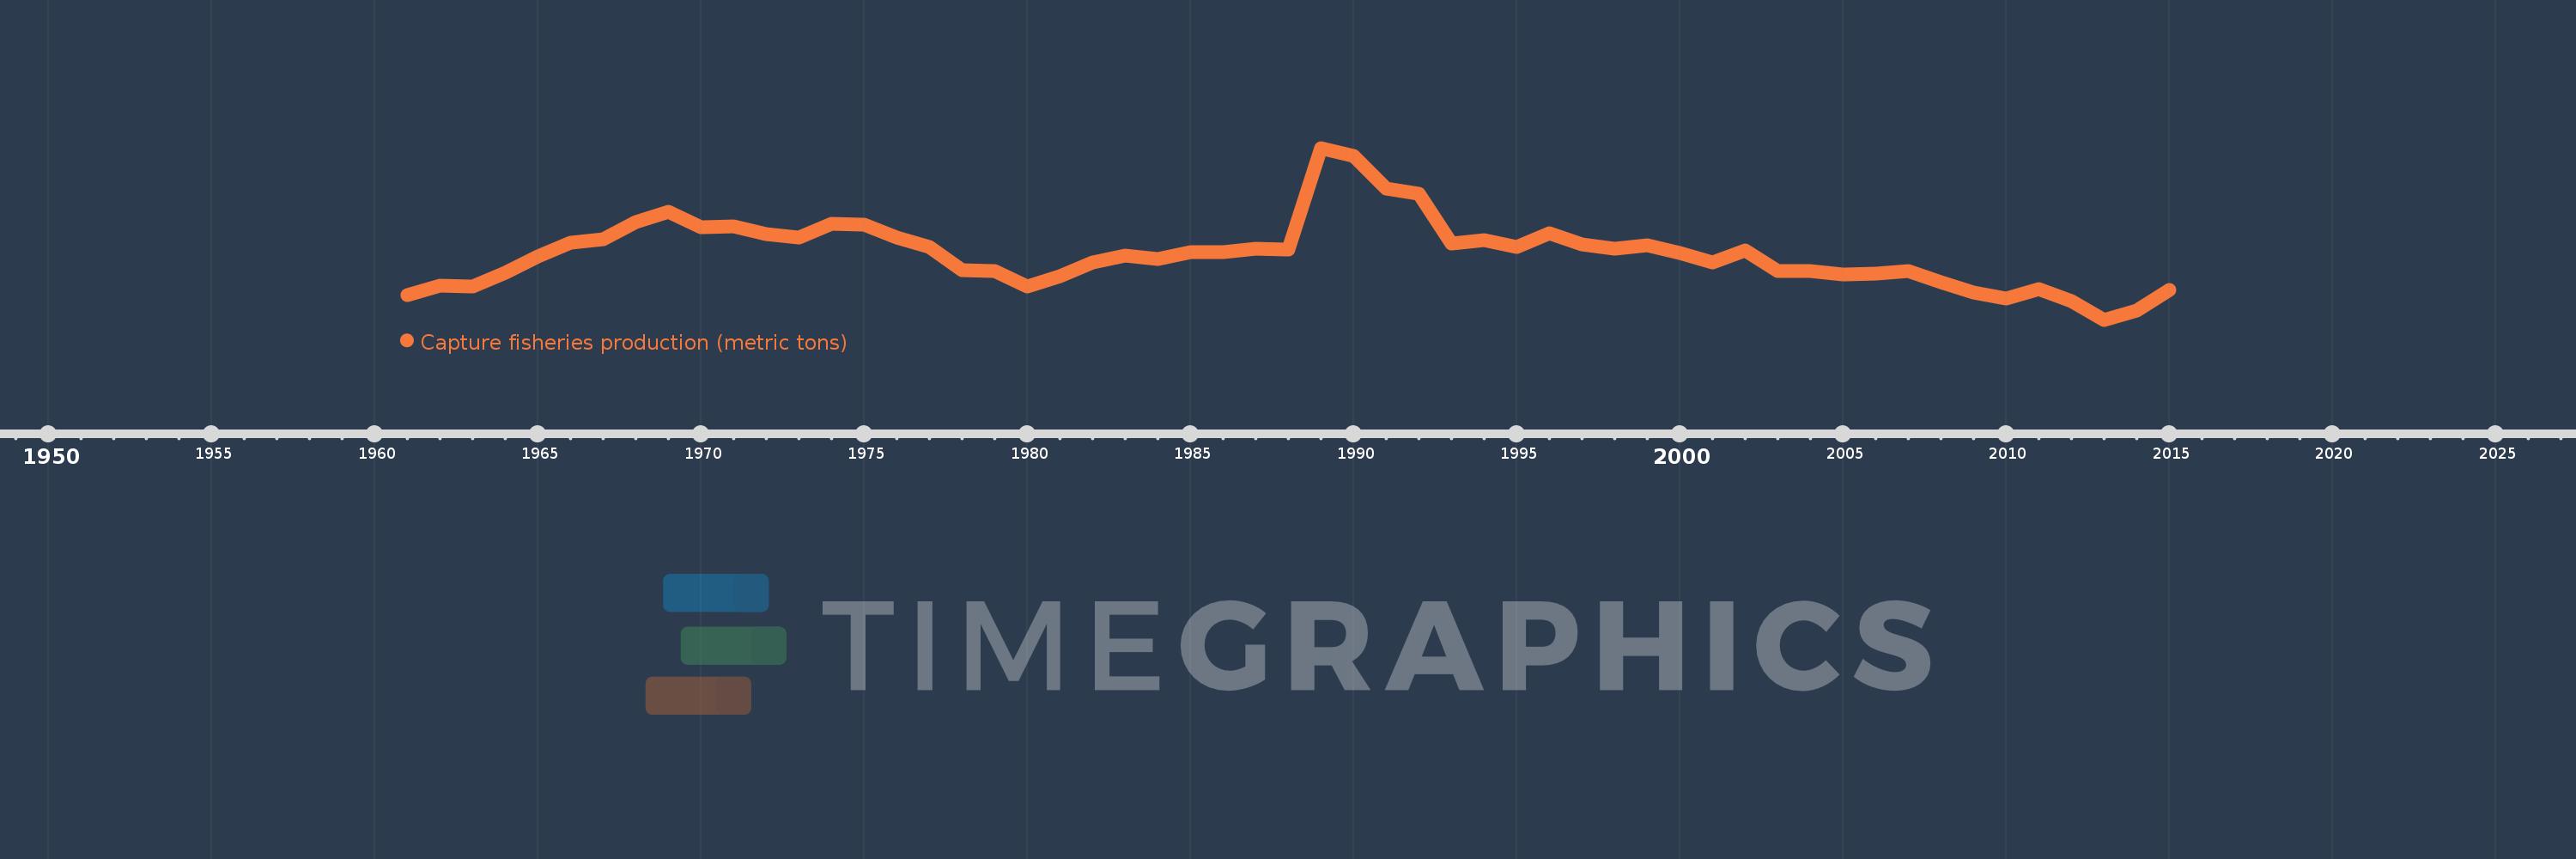
Capture fisheries production (metric tons)
2015,2014,2013,2012,2011,2010,2009,2008,2007,2006,2005,2004,2003,2002,2001,2000,1999,1998,1997,1996,1995,1994,1993,1992,1991,1990,1989,1988,1987,1986,1985,1984,1983,1982,1981,1980,1979,1978,1977,1976,1975,1974,1973,1972,1971,1970,1969,1968,1967,1966,1965,1964,1963,1962,1961
This statistics in other country:
AfghanistanAlbaniaAlgeriaAmerican SamoaAngolaAntigua and BarbudaArab WorldArgentinaArmeniaArubaAustraliaAustriaAzerbaijanBahamas, TheBahrainBangladeshBarbadosBelarusBelgiumBelizeBeninBermudaBhutanBoliviaBosnia and HerzegovinaBotswanaBrazilBritish Virgin IslandsBrunei DarussalamBulgariaBurkina FasoBurundiCabo VerdeCambodiaCameroonCanadaCaribbean small statesCayman IslandsCentral African RepublicCentral Europe and the BalticsChadChannel IslandsChileChinaColombiaComorosCongo, Dem. Rep.Congo, Rep.Costa RicaCote d'IvoireCroatiaCubaCuracaoCyprusCzech RepublicDenmarkDjiboutiDominicaDominican RepublicEarly-demographic dividendEast Asia & PacificEast Asia & Pacific (excluding high income)East Asia & Pacific (IDA & IBRD countries)EcuadorEgypt, Arab Rep.El SalvadorEquatorial GuineaEritreaEstoniaEthiopiaEuro areaEurope & Central AsiaEurope & Central Asia (excluding high income)Europe & Central Asia (IDA & IBRD countries)European UnionFaroe IslandsFijiFinlandFragile and conflict affected situationsFranceFrench PolynesiaGabonGambia, TheGeorgiaGermanyGhanaGreeceGreenlandGrenadaGuamGuatemalaGuineaGuinea-BissauGuyanaHaitiHeavily indebted poor countries (HIPC)High incomeHondurasHong Kong SAR, ChinaHungaryIBRD onlyIcelandIDA & IBRD totalIDA blendIDA onlyIDA totalIndiaIndonesiaIran, Islamic Rep.IraqIrelandIsle of ManIsraelItalyJamaicaJapanJordanKazakhstanKenyaKiribatiKorea, Dem. People’s Rep.Korea, Rep.KuwaitKyrgyz RepublicLao PDRLate-demographic dividendLatin America & Caribbean Latin America & Caribbean (excluding high income)Latin America & the Caribbean (IDA & IBRD countries)LatviaLeast developed countries: UN classificationLebanonLesothoLiberiaLibyaLithuaniaLow & middle incomeLow incomeLower middle incomeMacao SAR, ChinaMacedonia, FYRMadagascarMalawiMalaysiaMaldivesMaliMaltaMarshall IslandsMauritaniaMauritiusMexicoMicronesia, Fed. Sts.Middle East & North AfricaMiddle East & North Africa (excluding high income)Middle East & North Africa (IDA & IBRD countries)Middle incomeMoldovaMonacoMongoliaMontenegroMoroccoMozambiqueMyanmarNamibiaNauruNepalNetherlandsNew CaledoniaNew ZealandNicaraguaNigerNigeriaNorth AmericaNorthern Mariana IslandsNorwayOECD membersOmanOther small statesPacific island small statesPakistanPalauPanamaPapua New GuineaParaguayPeruPhilippinesPolandPortugalPost-demographic dividendPre-demographic dividendPuerto RicoQatarRomaniaRussian FederationRwandaSamoaSao Tome and PrincipeSaudi ArabiaSenegalSerbiaSeychellesSierra LeoneSingaporeSint Maarten (Dutch part)Slovak RepublicSloveniaSmall statesSolomon IslandsSomaliaSouth AfricaSouth AsiaSouth Asia (IDA & IBRD)South SudanSpainSri LankaSt. Kitts and NevisSt. LuciaSt. Martin (French part)St. Vincent and the GrenadinesSub-Saharan Africa Sub-Saharan Africa (excluding high income)Sub-Saharan Africa (IDA & IBRD countries)SudanSurinameSwazilandSwedenSwitzerlandSyrian Arab RepublicTajikistanTanzaniaThailandTimor-LesteTogoTongaTrinidad and TobagoTunisiaTurkeyTurkmenistanTurks and Caicos IslandsTuvaluUgandaUkraineUnited Arab EmiratesUnited KingdomUnited StatesUpper middle incomeUruguayUzbekistanVanuatuVenezuela, RBVietnamVirgin Islands (U.S.)West Bank and GazaWorldYemen, Rep.ZambiaZimbabwe Timeline:
This timeline shows a graph from 1961 to 2015 of Euro area. No data until 1960. Number of actual observations by date: 55.
Source name:
World Development Indicators
Source organization:
Food and Agriculture Organization.
Categories, topics:
Environment
Last updated:
apr 23, 2017
Indicators value changes by year
Minimum:
3.182 mln
jan 1, 2013
Maximum:
5.518 mln
jan 1, 1989
At the date of observation
Value
Absolute change
Change from previous value
jan 1, 1961
3.519 mln
+3.519 mln
0.0%
jan 1, 1962
3.647 mln
+127.951K
3.64%
jan 1, 1963
3.632 mln
-14.602K
-0.4%
jan 1, 1964
3.82 mln
+187.672K
5.17%
jan 1, 1965
4.048 mln
+228.596K
5.98%
jan 1, 1966
4.225 mln
+176.887K
4.37%
jan 1, 1967
4.278 mln
+52.465K
1.24%
jan 1, 1968
4.506 mln
+228.116K
5.33%
jan 1, 1969
4.649 mln
+143.711K
3.19%
jan 1, 1970
4.444 mln
-205.754K
-4.43%
jan 1, 1971
4.455 mln
+11.217K
0.25%
jan 1, 1972
4.342 mln
-113.275K
-2.54%
jan 1, 1973
4.295 mln
-46.097K
-1.06%
jan 1, 1974
4.483 mln
+187.199K
4.36%
jan 1, 1975
4.474 mln
-9.131K
-0.2%
jan 1, 1976
4.305 mln
-168.135K
-3.76%
jan 1, 1977
4.172 mln
-133.366K
-3.1%
jan 1, 1978
3.855 mln
-317.514K
-7.61%
jan 1, 1979
3.842 mln
-12.04K
-0.31%
jan 1, 1980
3.631 mln
-211.965K
-5.52%
jan 1, 1981
3.774 mln
+143.738K
3.96%
jan 1, 1982
3.963 mln
+188.293K
4.99%
jan 1, 1983
4.05 mln
+87.214K
2.2%
jan 1, 1984
4.007 mln
-42.552K
-1.05%
jan 1, 1985
4.105 mln
+98.025K
2.45%
jan 1, 1986
4.107 mln
+1.655K
0.04%
jan 1, 1987
4.144 mln
+37.024K
0.9%
jan 1, 1988
4.133 mln
-10.487K
-0.25%
jan 1, 1989
5.518 mln
+1.384 mln
33.49%
jan 1, 1990
5.406 mln
-112.086K
-2.03%
jan 1, 1991
4.969 mln
-436.504K
-8.07%
jan 1, 1992
4.895 mln
-74.642K
-1.5%
jan 1, 1993
4.217 mln
-677.713K
-13.85%
jan 1, 1994
4.269 mln
+52.347K
1.24%
jan 1, 1995
4.167 mln
-102.296K
-2.4%
jan 1, 1996
4.364 mln
+196.882K
4.72%
jan 1, 1997
4.205 mln
-158.426K
-3.63%
jan 1, 1998
4.149 mln
-56.607K
-1.35%
jan 1, 1999
4.197 mln
+48.383K
1.17%
jan 1, 2000
4.089 mln
-108.599K
-2.59%
jan 1, 2001
3.961 mln
-127.839K
-3.13%
jan 1, 2002
4.125 mln
+163.879K
4.14%
jan 1, 2003
3.848 mln
-276.394K
-6.7%
jan 1, 2004
3.84 mln
-8.486K
-0.22%
jan 1, 2005
3.794 mln
-45.974K
-1.2%
jan 1, 2006
3.812 mln
+18.714K
0.49%
jan 1, 2007
3.843 mln
+30.19K
0.79%
jan 1, 2008
3.687 mln
-155.836K
-4.06%
jan 1, 2009
3.556 mln
-131.224K
-3.56%
jan 1, 2010
3.469 mln
-86.336K
-2.43%
jan 1, 2011
3.598 mln
+128.677K
3.71%
jan 1, 2012
3.441 mln
-156.596K
-4.35%
jan 1, 2013
3.182 mln
-259.025K
-7.53%
jan 1, 2014
3.308 mln
+126.008K
3.96%
jan 1, 2015
3.585 mln
+276.234K
8.35%
Ranking of countries by current statistics by years


Comments: