29
/
en
AIzaSyAYiBZKx7MnpbEhh9jyipgxe19OcubqV5w
April 1, 2024
130147
Ethiopia
ETH
true
2
1
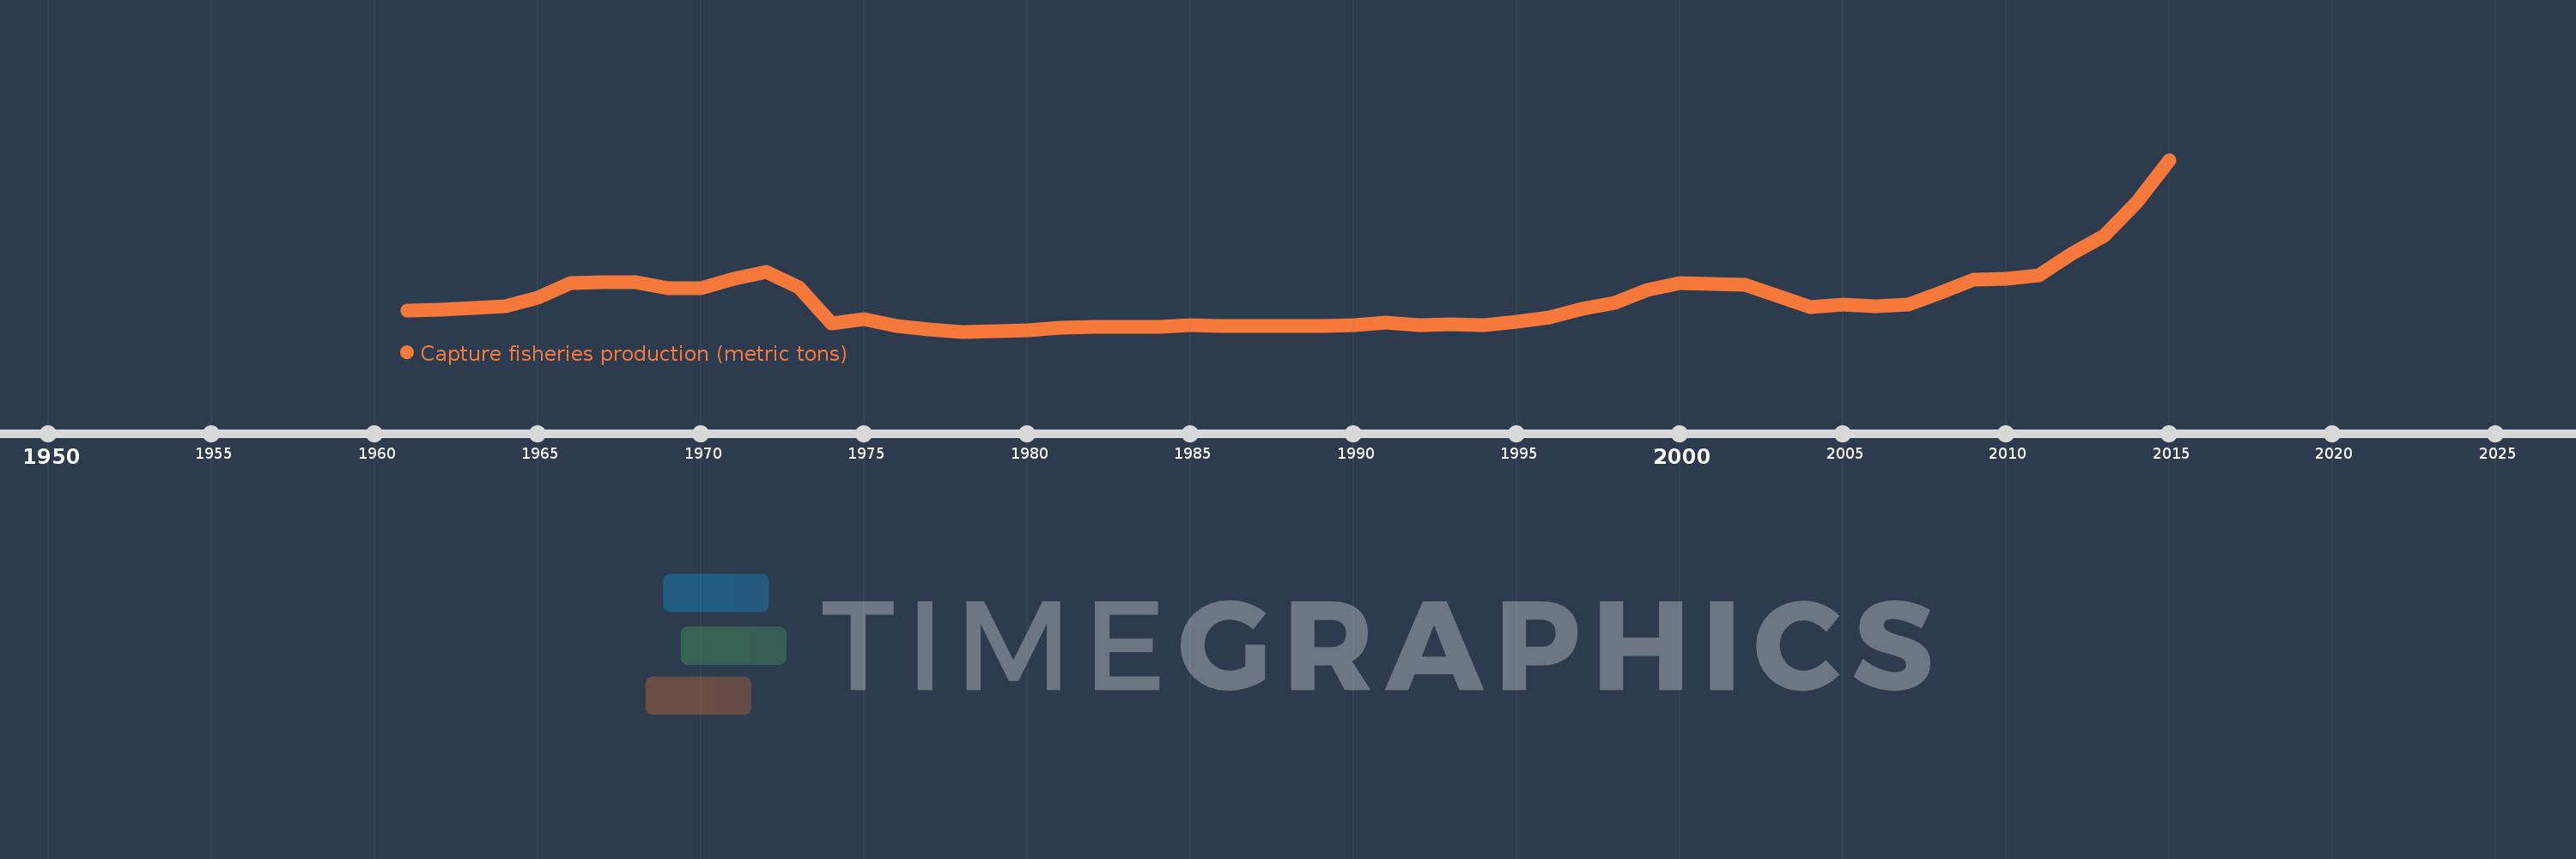
Capture fisheries production (metric tons)
2015,2014,2013,2012,2011,2010,2009,2008,2007,2006,2005,2004,2003,2002,2001,2000,1999,1998,1997,1996,1995,1994,1993,1992,1991,1990,1989,1988,1987,1986,1985,1984,1983,1982,1981,1980,1979,1978,1977,1976,1975,1974,1973,1972,1971,1970,1969,1968,1967,1966,1965,1964,1963,1962,1961
This statistics in other country:
AfghanistanAlbaniaAlgeriaAmerican SamoaAngolaAntigua and BarbudaArab WorldArgentinaArmeniaArubaAustraliaAustriaAzerbaijanBahamas, TheBahrainBangladeshBarbadosBelarusBelgiumBelizeBeninBermudaBhutanBoliviaBosnia and HerzegovinaBotswanaBrazilBritish Virgin IslandsBrunei DarussalamBulgariaBurkina FasoBurundiCabo VerdeCambodiaCameroonCanadaCaribbean small statesCayman IslandsCentral African RepublicCentral Europe and the BalticsChadChannel IslandsChileChinaColombiaComorosCongo, Dem. Rep.Congo, Rep.Costa RicaCote d'IvoireCroatiaCubaCuracaoCyprusCzech RepublicDenmarkDjiboutiDominicaDominican RepublicEarly-demographic dividendEast Asia & PacificEast Asia & Pacific (excluding high income)East Asia & Pacific (IDA & IBRD countries)EcuadorEgypt, Arab Rep.El SalvadorEquatorial GuineaEritreaEstoniaEthiopiaEuro areaEurope & Central AsiaEurope & Central Asia (excluding high income)Europe & Central Asia (IDA & IBRD countries)European UnionFaroe IslandsFijiFinlandFragile and conflict affected situationsFranceFrench PolynesiaGabonGambia, TheGeorgiaGermanyGhanaGreeceGreenlandGrenadaGuamGuatemalaGuineaGuinea-BissauGuyanaHaitiHeavily indebted poor countries (HIPC)High incomeHondurasHong Kong SAR, ChinaHungaryIBRD onlyIcelandIDA & IBRD totalIDA blendIDA onlyIDA totalIndiaIndonesiaIran, Islamic Rep.IraqIrelandIsle of ManIsraelItalyJamaicaJapanJordanKazakhstanKenyaKiribatiKorea, Dem. People’s Rep.Korea, Rep.KuwaitKyrgyz RepublicLao PDRLate-demographic dividendLatin America & Caribbean Latin America & Caribbean (excluding high income)Latin America & the Caribbean (IDA & IBRD countries)LatviaLeast developed countries: UN classificationLebanonLesothoLiberiaLibyaLithuaniaLow & middle incomeLow incomeLower middle incomeMacao SAR, ChinaMacedonia, FYRMadagascarMalawiMalaysiaMaldivesMaliMaltaMarshall IslandsMauritaniaMauritiusMexicoMicronesia, Fed. Sts.Middle East & North AfricaMiddle East & North Africa (excluding high income)Middle East & North Africa (IDA & IBRD countries)Middle incomeMoldovaMonacoMongoliaMontenegroMoroccoMozambiqueMyanmarNamibiaNauruNepalNetherlandsNew CaledoniaNew ZealandNicaraguaNigerNigeriaNorth AmericaNorthern Mariana IslandsNorwayOECD membersOmanOther small statesPacific island small statesPakistanPalauPanamaPapua New GuineaParaguayPeruPhilippinesPolandPortugalPost-demographic dividendPre-demographic dividendPuerto RicoQatarRomaniaRussian FederationRwandaSamoaSao Tome and PrincipeSaudi ArabiaSenegalSerbiaSeychellesSierra LeoneSingaporeSint Maarten (Dutch part)Slovak RepublicSloveniaSmall statesSolomon IslandsSomaliaSouth AfricaSouth AsiaSouth Asia (IDA & IBRD)South SudanSpainSri LankaSt. Kitts and NevisSt. LuciaSt. Martin (French part)St. Vincent and the GrenadinesSub-Saharan Africa Sub-Saharan Africa (excluding high income)Sub-Saharan Africa (IDA & IBRD countries)SudanSurinameSwazilandSwedenSwitzerlandSyrian Arab RepublicTajikistanTanzaniaThailandTimor-LesteTogoTongaTrinidad and TobagoTunisiaTurkeyTurkmenistanTurks and Caicos IslandsTuvaluUgandaUkraineUnited Arab EmiratesUnited KingdomUnited StatesUpper middle incomeUruguayUzbekistanVanuatuVenezuela, RBVietnamVirgin Islands (U.S.)West Bank and GazaWorldYemen, Rep.ZambiaZimbabwe Timeline:
This timeline shows a graph from 1961 to 2015 of Ethiopia. No data until 1960. Number of actual observations by date: 55.
Source name:
World Development Indicators
Source organization:
Food and Agriculture Organization.
Categories, topics:
Environment
Last updated:
apr 23, 2017
Indicators value changes by year
Minimum:
2.472K
jan 1, 1978
Maximum:
50.119K
jan 1, 2015
At the date of observation
Value
Absolute change
Change from previous value
jan 1, 1961
8.3K
+8.3K
0.0%
jan 1, 1962
8.6K
+300.0
3.61%
jan 1, 1963
9.1K
+500.0
5.81%
jan 1, 1964
9.6K
+500.0
5.49%
jan 1, 1965
12.0K
+2.4K
25.0%
jan 1, 1966
15.9K
+3.9K
32.5%
jan 1, 1967
16.2K
+300.0
1.89%
jan 1, 1968
16.2K
0.0
0.0%
jan 1, 1969
14.6K
-1.6K
-9.88%
jan 1, 1970
14.4K
-200.0
-1.37%
jan 1, 1971
17.2K
+2.8K
19.44%
jan 1, 1972
19.1K
+1.9K
11.05%
jan 1, 1973
14.8K
-4.3K
-22.51%
jan 1, 1974
4.7K
-10.1K
-68.24%
jan 1, 1975
5.9K
+1.2K
25.53%
jan 1, 1976
3.93K
-1.97K
-33.39%
jan 1, 1977
2.97K
-960.0
-24.43%
jan 1, 1978
2.472K
-498.0
-16.77%
jan 1, 1979
2.515K
+43.0
1.74%
jan 1, 1980
2.8K
+285.0
11.33%
jan 1, 1981
3.507K
+707.0
25.25%
jan 1, 1982
3.828K
+321.0
9.15%
jan 1, 1983
3.75K
-78.0
-2.04%
jan 1, 1984
3.9K
+150.0
4.0%
jan 1, 1985
4.3K
+400.0
10.26%
jan 1, 1986
4.0K
-300.0
-6.98%
jan 1, 1987
4.1K
+100.0
2.5%
jan 1, 1988
4.0K
-100.0
-2.44%
jan 1, 1989
4.066K
+66.0
1.65%
jan 1, 1990
4.236K
+170.0
4.18%
jan 1, 1991
4.945K
+709.0
16.74%
jan 1, 1992
4.226K
-719.0
-14.54%
jan 1, 1993
4.585K
+359.0
8.5%
jan 1, 1994
4.175K
-410.0
-8.94%
jan 1, 1995
5.285K
+1.11K
26.59%
jan 1, 1996
6.325K
+1.04K
19.68%
jan 1, 1997
8.77K
+2.445K
38.66%
jan 1, 1998
10.37K
+1.6K
18.24%
jan 1, 1999
14.0K
+3.63K
35.0%
jan 1, 2000
15.858K
+1.858K
13.27%
jan 1, 2001
15.681K
-177.0
-1.12%
jan 1, 2002
15.39K
-291.0
-1.86%
jan 1, 2003
12.3K
-3.09K
-20.08%
jan 1, 2004
9.213K
-3.087K
-25.1%
jan 1, 2005
10.005K
+792.0
8.6%
jan 1, 2006
9.45K
-555.0
-5.55%
jan 1, 2007
9.89K
+440.0
4.66%
jan 1, 2008
13.254K
+3.364K
34.01%
jan 1, 2009
16.77K
+3.516K
26.53%
jan 1, 2010
17.047K
+277.0
1.65%
jan 1, 2011
18.058K
+1.011K
5.93%
jan 1, 2012
24.041K
+5.983K
33.13%
jan 1, 2013
28.952K
+4.911K
20.43%
jan 1, 2014
38.371K
+9.419K
32.53%
jan 1, 2015
50.119K
+11.748K
30.62%
Ranking of countries by current statistics by years


Comments: