29
/
en
AIzaSyAYiBZKx7MnpbEhh9jyipgxe19OcubqV5w
April 1, 2024
267698
Tunisia
TUN
true
2
1
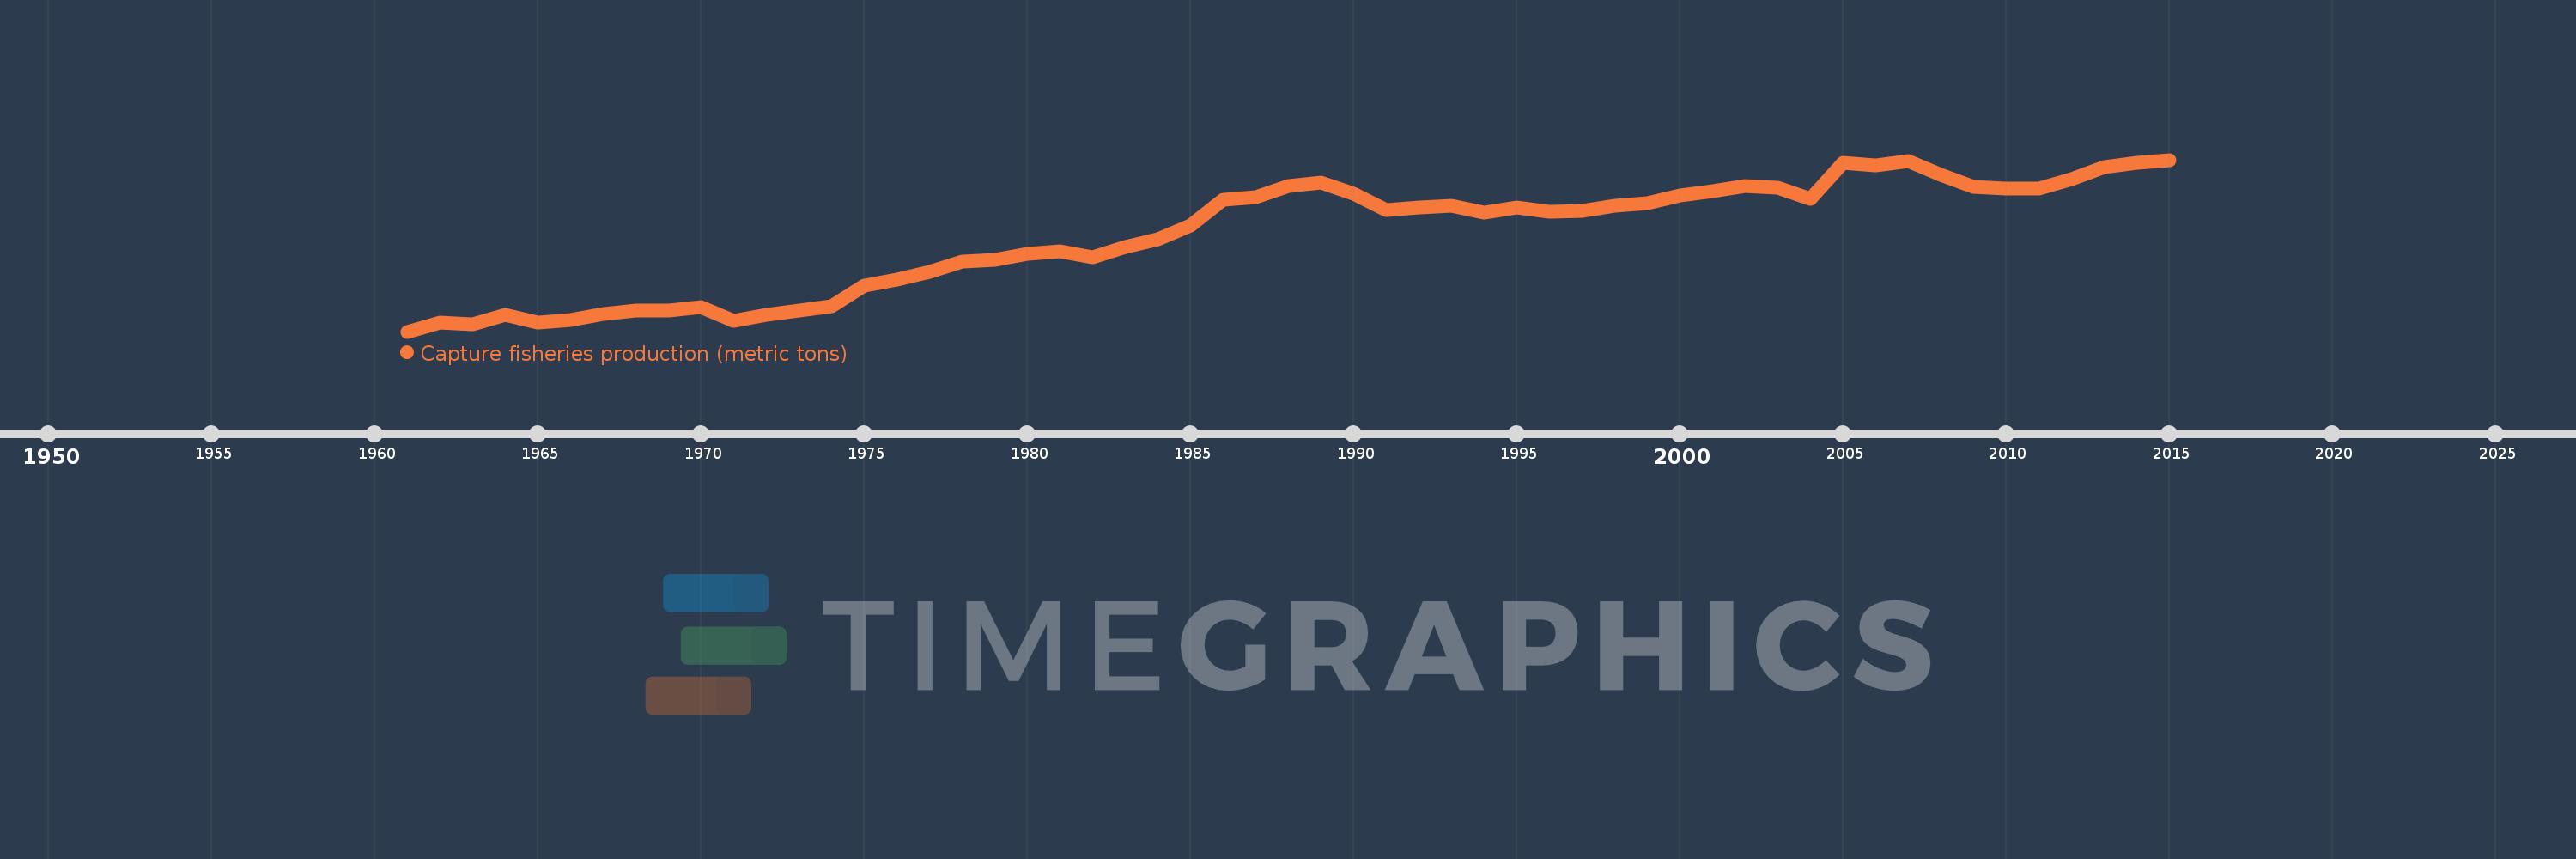
Capture fisheries production (metric tons)
2015,2014,2013,2012,2011,2010,2009,2008,2007,2006,2005,2004,2003,2002,2001,2000,1999,1998,1997,1996,1995,1994,1993,1992,1991,1990,1989,1988,1987,1986,1985,1984,1983,1982,1981,1980,1979,1978,1977,1976,1975,1974,1973,1972,1971,1970,1969,1968,1967,1966,1965,1964,1963,1962,1961
This statistics in other country:
AfghanistanAlbaniaAlgeriaAmerican SamoaAngolaAntigua and BarbudaArab WorldArgentinaArmeniaArubaAustraliaAustriaAzerbaijanBahamas, TheBahrainBangladeshBarbadosBelarusBelgiumBelizeBeninBermudaBhutanBoliviaBosnia and HerzegovinaBotswanaBrazilBritish Virgin IslandsBrunei DarussalamBulgariaBurkina FasoBurundiCabo VerdeCambodiaCameroonCanadaCaribbean small statesCayman IslandsCentral African RepublicCentral Europe and the BalticsChadChannel IslandsChileChinaColombiaComorosCongo, Dem. Rep.Congo, Rep.Costa RicaCote d'IvoireCroatiaCubaCuracaoCyprusCzech RepublicDenmarkDjiboutiDominicaDominican RepublicEarly-demographic dividendEast Asia & PacificEast Asia & Pacific (excluding high income)East Asia & Pacific (IDA & IBRD countries)EcuadorEgypt, Arab Rep.El SalvadorEquatorial GuineaEritreaEstoniaEthiopiaEuro areaEurope & Central AsiaEurope & Central Asia (excluding high income)Europe & Central Asia (IDA & IBRD countries)European UnionFaroe IslandsFijiFinlandFragile and conflict affected situationsFranceFrench PolynesiaGabonGambia, TheGeorgiaGermanyGhanaGreeceGreenlandGrenadaGuamGuatemalaGuineaGuinea-BissauGuyanaHaitiHeavily indebted poor countries (HIPC)High incomeHondurasHong Kong SAR, ChinaHungaryIBRD onlyIcelandIDA & IBRD totalIDA blendIDA onlyIDA totalIndiaIndonesiaIran, Islamic Rep.IraqIrelandIsle of ManIsraelItalyJamaicaJapanJordanKazakhstanKenyaKiribatiKorea, Dem. People’s Rep.Korea, Rep.KuwaitKyrgyz RepublicLao PDRLate-demographic dividendLatin America & Caribbean Latin America & Caribbean (excluding high income)Latin America & the Caribbean (IDA & IBRD countries)LatviaLeast developed countries: UN classificationLebanonLesothoLiberiaLibyaLithuaniaLow & middle incomeLow incomeLower middle incomeMacao SAR, ChinaMacedonia, FYRMadagascarMalawiMalaysiaMaldivesMaliMaltaMarshall IslandsMauritaniaMauritiusMexicoMicronesia, Fed. Sts.Middle East & North AfricaMiddle East & North Africa (excluding high income)Middle East & North Africa (IDA & IBRD countries)Middle incomeMoldovaMonacoMongoliaMontenegroMoroccoMozambiqueMyanmarNamibiaNauruNepalNetherlandsNew CaledoniaNew ZealandNicaraguaNigerNigeriaNorth AmericaNorthern Mariana IslandsNorwayOECD membersOmanOther small statesPacific island small statesPakistanPalauPanamaPapua New GuineaParaguayPeruPhilippinesPolandPortugalPost-demographic dividendPre-demographic dividendPuerto RicoQatarRomaniaRussian FederationRwandaSamoaSao Tome and PrincipeSaudi ArabiaSenegalSerbiaSeychellesSierra LeoneSingaporeSint Maarten (Dutch part)Slovak RepublicSloveniaSmall statesSolomon IslandsSomaliaSouth AfricaSouth AsiaSouth Asia (IDA & IBRD)South SudanSpainSri LankaSt. Kitts and NevisSt. LuciaSt. Martin (French part)St. Vincent and the GrenadinesSub-Saharan Africa Sub-Saharan Africa (excluding high income)Sub-Saharan Africa (IDA & IBRD countries)SudanSurinameSwazilandSwedenSwitzerlandSyrian Arab RepublicTajikistanTanzaniaThailandTimor-LesteTogoTongaTrinidad and TobagoTunisiaTurkeyTurkmenistanTurks and Caicos IslandsTuvaluUgandaUkraineUnited Arab EmiratesUnited KingdomUnited StatesUpper middle incomeUruguayUzbekistanVanuatuVenezuela, RBVietnamVirgin Islands (U.S.)West Bank and GazaWorldYemen, Rep.ZambiaZimbabwe Timeline:
This timeline shows a graph from 1961 to 2015 of Tunisia. No data until 1960. Number of actual observations by date: 55.
Source name:
World Development Indicators
Source organization:
Food and Agriculture Organization.
Categories, topics:
Environment
Last updated:
apr 23, 2017
Indicators value changes by year
Minimum:
16.65K
jan 1, 1961
Maximum:
112.047K
jan 1, 2015
At the date of observation
Value
Absolute change
Change from previous value
jan 1, 1961
16.65K
+16.65K
0.0%
jan 1, 1962
21.8K
+5.15K
30.93%
jan 1, 1963
20.804K
-996.0
-4.57%
jan 1, 1964
26.06K
+5.256K
25.26%
jan 1, 1965
21.676K
-4.384K
-16.82%
jan 1, 1966
23.201K
+1.525K
7.04%
jan 1, 1967
26.193K
+2.992K
12.9%
jan 1, 1968
28.207K
+2.014K
7.69%
jan 1, 1969
28.484K
+277.0
0.98%
jan 1, 1970
30.127K
+1.643K
5.77%
jan 1, 1971
22.66K
-7.467K
-24.79%
jan 1, 1972
25.87K
+3.21K
14.17%
jan 1, 1973
28.289K
+2.419K
9.35%
jan 1, 1974
30.674K
+2.385K
8.43%
jan 1, 1975
42.347K
+11.673K
38.06%
jan 1, 1976
45.271K
+2.924K
6.9%
jan 1, 1977
50.024K
+4.753K
10.5%
jan 1, 1978
55.721K
+5.697K
11.39%
jan 1, 1979
56.397K
+675.8
1.21%
jan 1, 1980
59.708K
+3.311K
5.87%
jan 1, 1981
61.068K
+1.359K
2.28%
jan 1, 1982
57.995K
-3.072K
-5.03%
jan 1, 1983
63.689K
+5.694K
9.82%
jan 1, 1984
67.951K
+4.262K
6.69%
jan 1, 1985
75.739K
+7.788K
11.46%
jan 1, 1986
89.679K
+13.939K
18.4%
jan 1, 1987
91.221K
+1.542K
1.72%
jan 1, 1988
97.504K
+6.284K
6.89%
jan 1, 1989
99.183K
+1.679K
1.72%
jan 1, 1990
93.118K
-6.066K
-6.12%
jan 1, 1991
84.214K
-8.904K
-9.56%
jan 1, 1992
85.736K
+1.522K
1.81%
jan 1, 1993
86.488K
+752.448
0.88%
jan 1, 1994
82.622K
-3.866K
-4.47%
jan 1, 1995
85.81K
+3.188K
3.86%
jan 1, 1996
83.256K
-2.554K
-2.98%
jan 1, 1997
83.534K
+278.295
0.33%
jan 1, 1998
86.39K
+2.856K
3.42%
jan 1, 1999
88.098K
+1.707K
1.98%
jan 1, 2000
92.395K
+4.298K
4.88%
jan 1, 2001
94.671K
+2.276K
2.46%
jan 1, 2002
97.526K
+2.855K
3.02%
jan 1, 2003
96.728K
-798.526
-0.82%
jan 1, 2004
90.262K
-6.465K
-6.68%
jan 1, 2005
110.372K
+20.11K
22.28%
jan 1, 2006
109.153K
-1.218K
-1.1%
jan 1, 2007
111.395K
+2.241K
2.05%
jan 1, 2008
103.821K
-7.573K
-6.8%
jan 1, 2009
97.211K
-6.61K
-6.37%
jan 1, 2010
96.261K
-949.94
-0.98%
jan 1, 2011
96.24K
-21.009
-0.02%
jan 1, 2012
101.344K
+5.104K
5.3%
jan 1, 2013
108.163K
+6.819K
6.73%
jan 1, 2014
110.408K
+2.245K
2.08%
jan 1, 2015
112.047K
+1.639K
1.48%
Ranking of countries by current statistics by years


Comments: