29
/
en
AIzaSyAYiBZKx7MnpbEhh9jyipgxe19OcubqV5w
April 1, 2024
100882
Canada
CAN
true
2
1
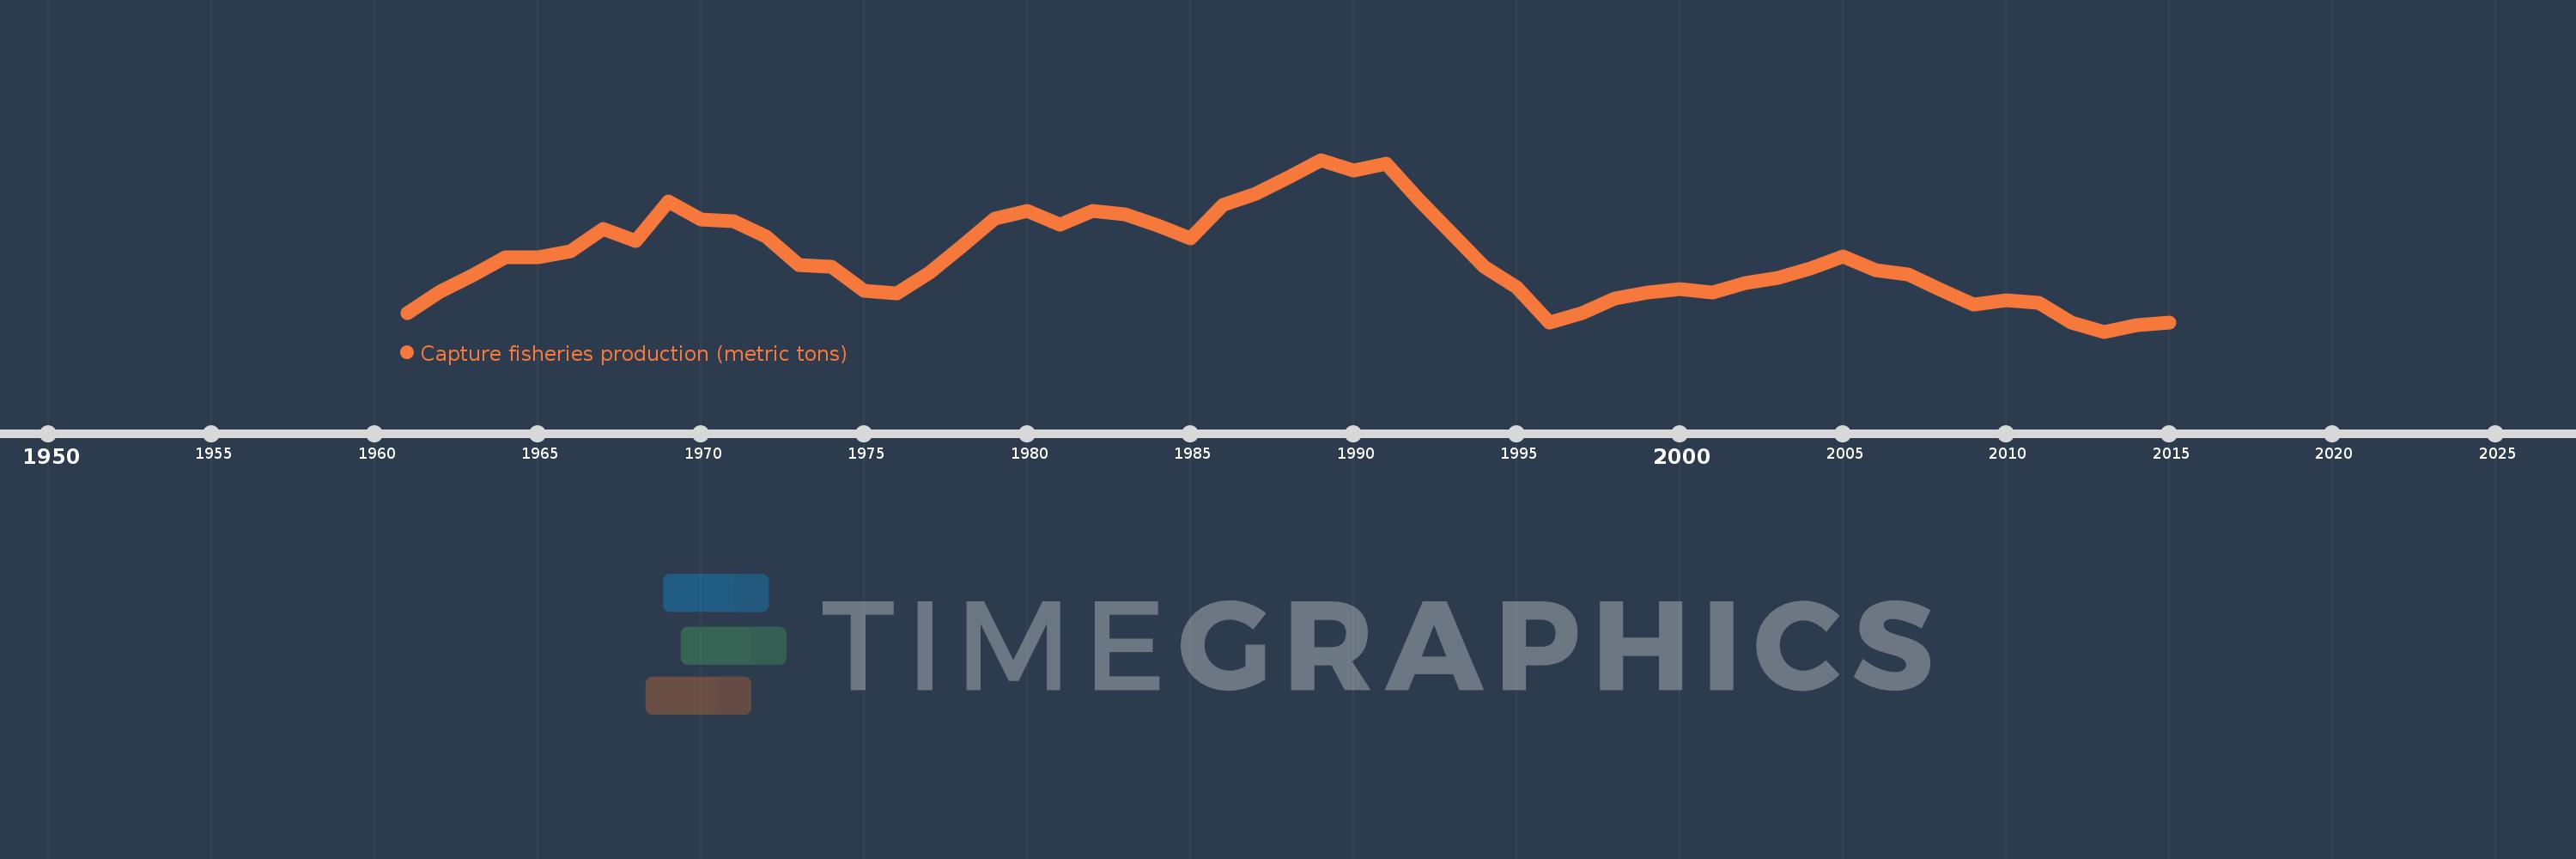
Capture fisheries production (metric tons)
2015,2014,2013,2012,2011,2010,2009,2008,2007,2006,2005,2004,2003,2002,2001,2000,1999,1998,1997,1996,1995,1994,1993,1992,1991,1990,1989,1988,1987,1986,1985,1984,1983,1982,1981,1980,1979,1978,1977,1976,1975,1974,1973,1972,1971,1970,1969,1968,1967,1966,1965,1964,1963,1962,1961
This statistics in other country:
AfghanistanAlbaniaAlgeriaAmerican SamoaAngolaAntigua and BarbudaArab WorldArgentinaArmeniaArubaAustraliaAustriaAzerbaijanBahamas, TheBahrainBangladeshBarbadosBelarusBelgiumBelizeBeninBermudaBhutanBoliviaBosnia and HerzegovinaBotswanaBrazilBritish Virgin IslandsBrunei DarussalamBulgariaBurkina FasoBurundiCabo VerdeCambodiaCameroonCanadaCaribbean small statesCayman IslandsCentral African RepublicCentral Europe and the BalticsChadChannel IslandsChileChinaColombiaComorosCongo, Dem. Rep.Congo, Rep.Costa RicaCote d'IvoireCroatiaCubaCuracaoCyprusCzech RepublicDenmarkDjiboutiDominicaDominican RepublicEarly-demographic dividendEast Asia & PacificEast Asia & Pacific (excluding high income)East Asia & Pacific (IDA & IBRD countries)EcuadorEgypt, Arab Rep.El SalvadorEquatorial GuineaEritreaEstoniaEthiopiaEuro areaEurope & Central AsiaEurope & Central Asia (excluding high income)Europe & Central Asia (IDA & IBRD countries)European UnionFaroe IslandsFijiFinlandFragile and conflict affected situationsFranceFrench PolynesiaGabonGambia, TheGeorgiaGermanyGhanaGreeceGreenlandGrenadaGuamGuatemalaGuineaGuinea-BissauGuyanaHaitiHeavily indebted poor countries (HIPC)High incomeHondurasHong Kong SAR, ChinaHungaryIBRD onlyIcelandIDA & IBRD totalIDA blendIDA onlyIDA totalIndiaIndonesiaIran, Islamic Rep.IraqIrelandIsle of ManIsraelItalyJamaicaJapanJordanKazakhstanKenyaKiribatiKorea, Dem. People’s Rep.Korea, Rep.KuwaitKyrgyz RepublicLao PDRLate-demographic dividendLatin America & Caribbean Latin America & Caribbean (excluding high income)Latin America & the Caribbean (IDA & IBRD countries)LatviaLeast developed countries: UN classificationLebanonLesothoLiberiaLibyaLithuaniaLow & middle incomeLow incomeLower middle incomeMacao SAR, ChinaMacedonia, FYRMadagascarMalawiMalaysiaMaldivesMaliMaltaMarshall IslandsMauritaniaMauritiusMexicoMicronesia, Fed. Sts.Middle East & North AfricaMiddle East & North Africa (excluding high income)Middle East & North Africa (IDA & IBRD countries)Middle incomeMoldovaMonacoMongoliaMontenegroMoroccoMozambiqueMyanmarNamibiaNauruNepalNetherlandsNew CaledoniaNew ZealandNicaraguaNigerNigeriaNorth AmericaNorthern Mariana IslandsNorwayOECD membersOmanOther small statesPacific island small statesPakistanPalauPanamaPapua New GuineaParaguayPeruPhilippinesPolandPortugalPost-demographic dividendPre-demographic dividendPuerto RicoQatarRomaniaRussian FederationRwandaSamoaSao Tome and PrincipeSaudi ArabiaSenegalSerbiaSeychellesSierra LeoneSingaporeSint Maarten (Dutch part)Slovak RepublicSloveniaSmall statesSolomon IslandsSomaliaSouth AfricaSouth AsiaSouth Asia (IDA & IBRD)South SudanSpainSri LankaSt. Kitts and NevisSt. LuciaSt. Martin (French part)St. Vincent and the GrenadinesSub-Saharan Africa Sub-Saharan Africa (excluding high income)Sub-Saharan Africa (IDA & IBRD countries)SudanSurinameSwazilandSwedenSwitzerlandSyrian Arab RepublicTajikistanTanzaniaThailandTimor-LesteTogoTongaTrinidad and TobagoTunisiaTurkeyTurkmenistanTurks and Caicos IslandsTuvaluUgandaUkraineUnited Arab EmiratesUnited KingdomUnited StatesUpper middle incomeUruguayUzbekistanVanuatuVenezuela, RBVietnamVirgin Islands (U.S.)West Bank and GazaWorldYemen, Rep.ZambiaZimbabwe Timeline:
This timeline shows a graph from 1961 to 2015 of Canada. No data until 1960. Number of actual observations by date: 55.
Source name:
World Development Indicators
Source organization:
Food and Agriculture Organization.
Categories, topics:
Environment
Last updated:
apr 23, 2017
Indicators value changes by year
Minimum:
832.653K
jan 1, 2013
Maximum:
1.704 mln
jan 1, 1989
At the date of observation
Value
Absolute change
Change from previous value
jan 1, 1961
928.067K
+928.067K
0.0%
jan 1, 1962
1.034 mln
+105.813K
11.4%
jan 1, 1963
1.12 mln
+86.407K
8.36%
jan 1, 1964
1.21 mln
+89.655K
8.0%
jan 1, 1965
1.21 mln
+144.0
0.01%
jan 1, 1966
1.239 mln
+29.385K
2.43%
jan 1, 1967
1.355 mln
+115.953K
9.36%
jan 1, 1968
1.293 mln
-62.344K
-4.6%
jan 1, 1969
1.492 mln
+199.416K
15.42%
jan 1, 1970
1.401 mln
-91.037K
-6.1%
jan 1, 1971
1.392 mln
-8.961K
-0.64%
jan 1, 1972
1.314 mln
-78.742K
-5.65%
jan 1, 1973
1.17 mln
-143.662K
-10.94%
jan 1, 1974
1.164 mln
-6.332K
-0.54%
jan 1, 1975
1.041 mln
-122.489K
-10.53%
jan 1, 1976
1.028 mln
-13.502K
-1.3%
jan 1, 1977
1.13 mln
+102.721K
9.99%
jan 1, 1978
1.268 mln
+137.478K
12.16%
jan 1, 1979
1.404 mln
+136.142K
10.74%
jan 1, 1980
1.447 mln
+42.872K
3.05%
jan 1, 1981
1.373 mln
-73.625K
-5.09%
jan 1, 1982
1.444 mln
+70.968K
5.17%
jan 1, 1983
1.427 mln
-17.306K
-1.2%
jan 1, 1984
1.371 mln
-55.991K
-3.92%
jan 1, 1985
1.305 mln
-66.501K
-4.85%
jan 1, 1986
1.474 mln
+169.461K
12.99%
jan 1, 1987
1.532 mln
+57.729K
3.92%
jan 1, 1988
1.615 mln
+83.364K
5.44%
jan 1, 1989
1.704 mln
+89.327K
5.53%
jan 1, 1990
1.65 mln
-54.465K
-3.2%
jan 1, 1991
1.686 mln
+35.587K
2.16%
jan 1, 1992
1.5 mln
-185.134K
-10.98%
jan 1, 1993
1.33 mln
-169.908K
-11.32%
jan 1, 1994
1.162 mln
-168.231K
-12.64%
jan 1, 1995
1.057 mln
-105.165K
-9.05%
jan 1, 1996
880.353K
-176.741K
-16.72%
jan 1, 1997
925.943K
+45.59K
5.18%
jan 1, 1998
1.001 mln
+75.333K
8.14%
jan 1, 1999
1.031 mln
+30.097K
3.01%
jan 1, 2000
1.047 mln
+15.957K
1.55%
jan 1, 2001
1.033 mln
-14.644K
-1.4%
jan 1, 2002
1.077 mln
+44.238K
4.28%
jan 1, 2003
1.106 mln
+28.917K
2.69%
jan 1, 2004
1.154 mln
+47.947K
4.34%
jan 1, 2005
1.214 mln
+59.859K
5.19%
jan 1, 2006
1.146 mln
-68.023K
-5.6%
jan 1, 2007
1.123 mln
-23.018K
-2.01%
jan 1, 2008
1.045 mln
-77.62K
-6.91%
jan 1, 2009
967.88K
-77.106K
-7.38%
jan 1, 2010
993.175K
+25.295K
2.61%
jan 1, 2011
979.521K
-13.654K
-1.37%
jan 1, 2012
880.11K
-99.411K
-10.15%
jan 1, 2013
832.653K
-47.457K
-5.39%
jan 1, 2014
866.924K
+34.271K
4.12%
jan 1, 2015
876.725K
+9.801K
1.13%
Ranking of countries by current statistics by years


Comments: