29
/
en
AIzaSyAYiBZKx7MnpbEhh9jyipgxe19OcubqV5w
April 1, 2024
167169
Kenya
KEN
true
2
1
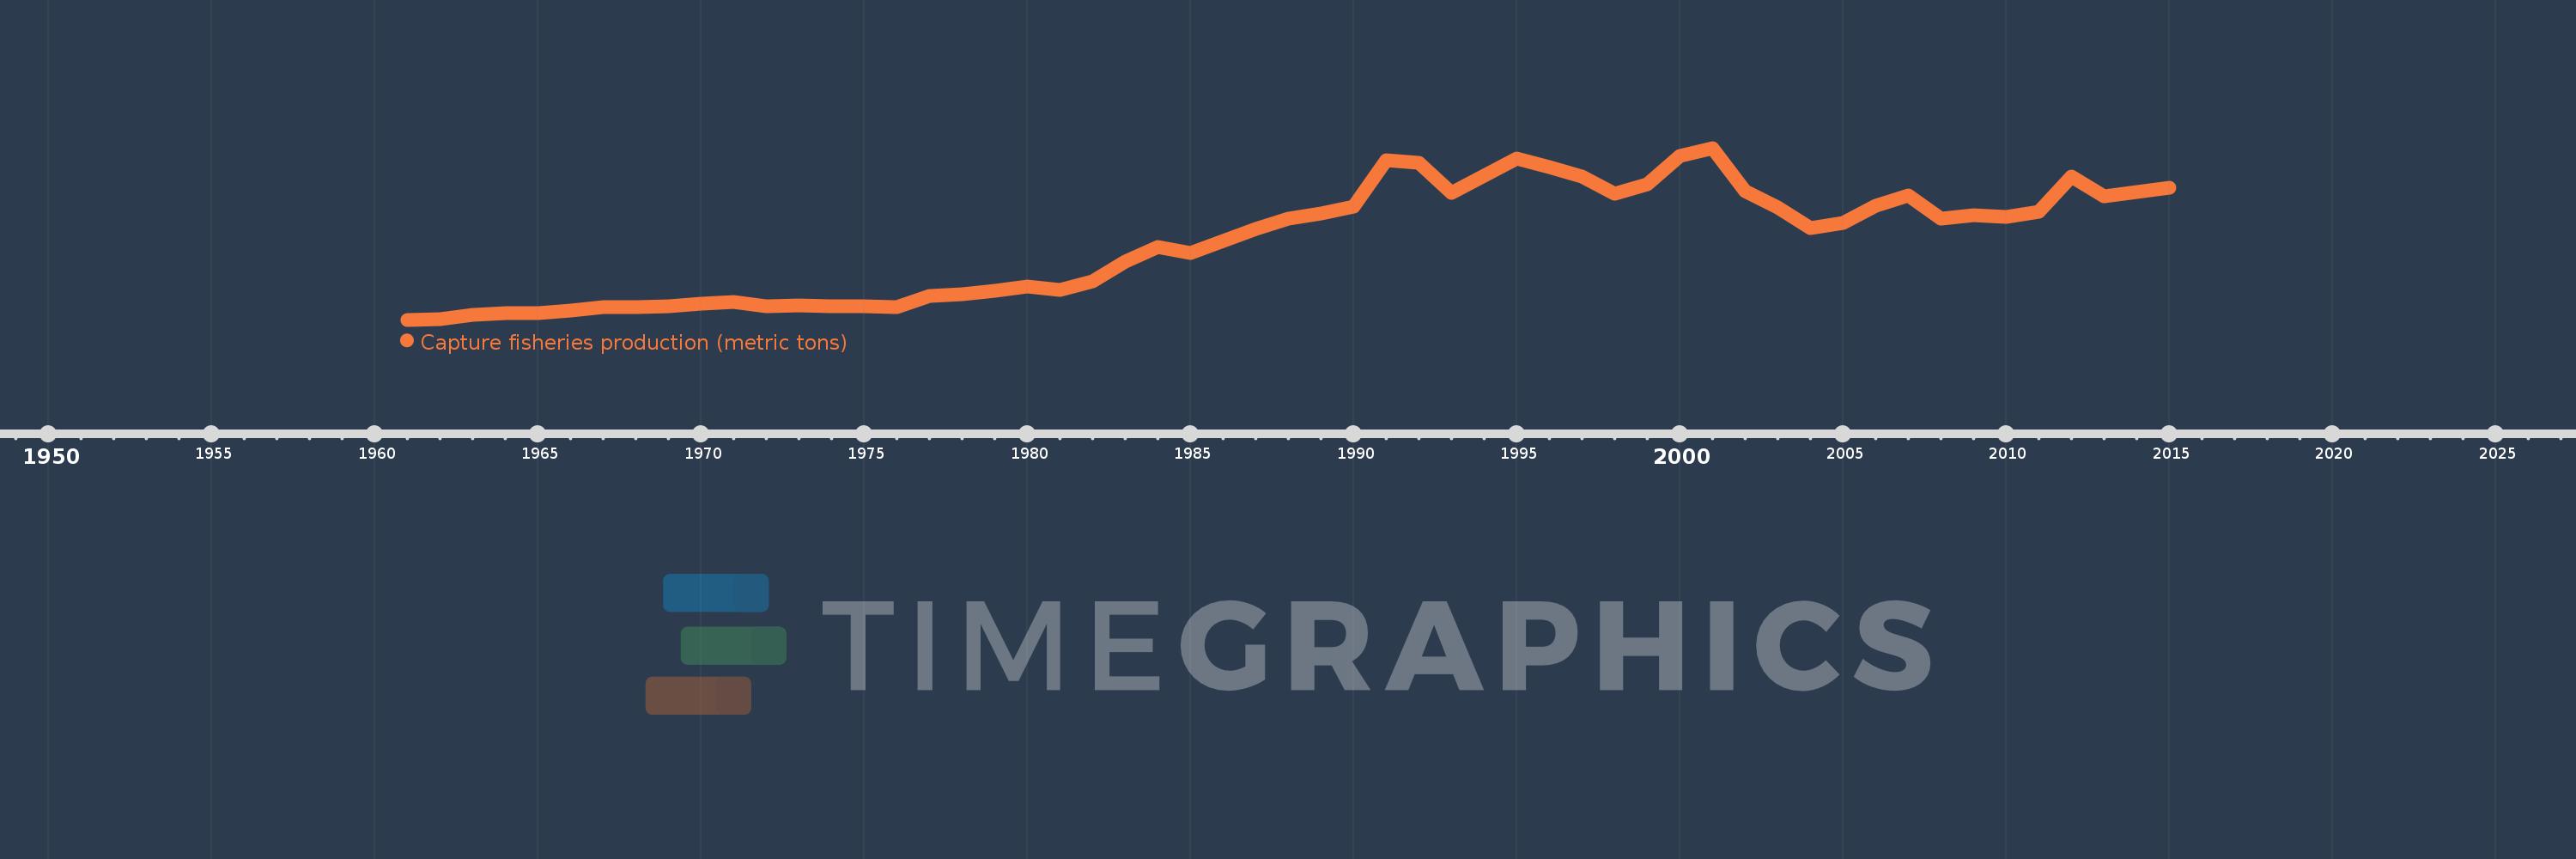
Capture fisheries production (metric tons)
2015,2014,2013,2012,2011,2010,2009,2008,2007,2006,2005,2004,2003,2002,2001,2000,1999,1998,1997,1996,1995,1994,1993,1992,1991,1990,1989,1988,1987,1986,1985,1984,1983,1982,1981,1980,1979,1978,1977,1976,1975,1974,1973,1972,1971,1970,1969,1968,1967,1966,1965,1964,1963,1962,1961
This statistics in other country:
AfghanistanAlbaniaAlgeriaAmerican SamoaAngolaAntigua and BarbudaArab WorldArgentinaArmeniaArubaAustraliaAustriaAzerbaijanBahamas, TheBahrainBangladeshBarbadosBelarusBelgiumBelizeBeninBermudaBhutanBoliviaBosnia and HerzegovinaBotswanaBrazilBritish Virgin IslandsBrunei DarussalamBulgariaBurkina FasoBurundiCabo VerdeCambodiaCameroonCanadaCaribbean small statesCayman IslandsCentral African RepublicCentral Europe and the BalticsChadChannel IslandsChileChinaColombiaComorosCongo, Dem. Rep.Congo, Rep.Costa RicaCote d'IvoireCroatiaCubaCuracaoCyprusCzech RepublicDenmarkDjiboutiDominicaDominican RepublicEarly-demographic dividendEast Asia & PacificEast Asia & Pacific (excluding high income)East Asia & Pacific (IDA & IBRD countries)EcuadorEgypt, Arab Rep.El SalvadorEquatorial GuineaEritreaEstoniaEthiopiaEuro areaEurope & Central AsiaEurope & Central Asia (excluding high income)Europe & Central Asia (IDA & IBRD countries)European UnionFaroe IslandsFijiFinlandFragile and conflict affected situationsFranceFrench PolynesiaGabonGambia, TheGeorgiaGermanyGhanaGreeceGreenlandGrenadaGuamGuatemalaGuineaGuinea-BissauGuyanaHaitiHeavily indebted poor countries (HIPC)High incomeHondurasHong Kong SAR, ChinaHungaryIBRD onlyIcelandIDA & IBRD totalIDA blendIDA onlyIDA totalIndiaIndonesiaIran, Islamic Rep.IraqIrelandIsle of ManIsraelItalyJamaicaJapanJordanKazakhstanKenyaKiribatiKorea, Dem. People’s Rep.Korea, Rep.KuwaitKyrgyz RepublicLao PDRLate-demographic dividendLatin America & Caribbean Latin America & Caribbean (excluding high income)Latin America & the Caribbean (IDA & IBRD countries)LatviaLeast developed countries: UN classificationLebanonLesothoLiberiaLibyaLithuaniaLow & middle incomeLow incomeLower middle incomeMacao SAR, ChinaMacedonia, FYRMadagascarMalawiMalaysiaMaldivesMaliMaltaMarshall IslandsMauritaniaMauritiusMexicoMicronesia, Fed. Sts.Middle East & North AfricaMiddle East & North Africa (excluding high income)Middle East & North Africa (IDA & IBRD countries)Middle incomeMoldovaMonacoMongoliaMontenegroMoroccoMozambiqueMyanmarNamibiaNauruNepalNetherlandsNew CaledoniaNew ZealandNicaraguaNigerNigeriaNorth AmericaNorthern Mariana IslandsNorwayOECD membersOmanOther small statesPacific island small statesPakistanPalauPanamaPapua New GuineaParaguayPeruPhilippinesPolandPortugalPost-demographic dividendPre-demographic dividendPuerto RicoQatarRomaniaRussian FederationRwandaSamoaSao Tome and PrincipeSaudi ArabiaSenegalSerbiaSeychellesSierra LeoneSingaporeSint Maarten (Dutch part)Slovak RepublicSloveniaSmall statesSolomon IslandsSomaliaSouth AfricaSouth AsiaSouth Asia (IDA & IBRD)South SudanSpainSri LankaSt. Kitts and NevisSt. LuciaSt. Martin (French part)St. Vincent and the GrenadinesSub-Saharan Africa Sub-Saharan Africa (excluding high income)Sub-Saharan Africa (IDA & IBRD countries)SudanSurinameSwazilandSwedenSwitzerlandSyrian Arab RepublicTajikistanTanzaniaThailandTimor-LesteTogoTongaTrinidad and TobagoTunisiaTurkeyTurkmenistanTurks and Caicos IslandsTuvaluUgandaUkraineUnited Arab EmiratesUnited KingdomUnited StatesUpper middle incomeUruguayUzbekistanVanuatuVenezuela, RBVietnamVirgin Islands (U.S.)West Bank and GazaWorldYemen, Rep.ZambiaZimbabwe Timeline:
This timeline shows a graph from 1961 to 2015 of Kenya. No data until 1960. Number of actual observations by date: 55.
Source name:
World Development Indicators
Source organization:
Food and Agriculture Organization.
Categories, topics:
Environment
Last updated:
apr 23, 2017
Indicators value changes by year
Maximum:
215.799K
jan 1, 2001
At the date of observation
Value
Absolute change
Change from previous value
jan 1, 1961
12.6K
+12.6K
0.0%
jan 1, 1962
13.5K
+900.0
7.14%
jan 1, 1963
18.4K
+4.9K
36.3%
jan 1, 1964
20.1K
+1.7K
9.24%
jan 1, 1965
20.7K
+600.0
2.99%
jan 1, 1966
23.4K
+2.7K
13.04%
jan 1, 1967
27.9K
+4.5K
19.23%
jan 1, 1968
27.3K
-600.0
-2.15%
jan 1, 1969
28.2K
+900.0
3.3%
jan 1, 1970
32.0K
+3.8K
13.48%
jan 1, 1971
33.7K
+1.7K
5.31%
jan 1, 1972
28.3K
-5.4K
-16.02%
jan 1, 1973
30.0K
+1.7K
6.01%
jan 1, 1974
29.0K
-1000.0
-3.33%
jan 1, 1975
28.581K
-419.0
-1.44%
jan 1, 1976
27.373K
-1.208K
-4.23%
jan 1, 1977
41.164K
+13.791K
50.38%
jan 1, 1978
43.009K
+1.845K
4.48%
jan 1, 1979
46.425K
+3.416K
7.94%
jan 1, 1980
51.735K
+5.31K
11.44%
jan 1, 1981
47.875K
-3.86K
-7.46%
jan 1, 1982
57.9K
+10.025K
20.94%
jan 1, 1983
81.718K
+23.818K
41.14%
jan 1, 1984
98.357K
+16.639K
20.36%
jan 1, 1985
91.127K
-7.23K
-7.35%
jan 1, 1986
106.251K
+15.124K
16.6%
jan 1, 1987
120.244K
+13.993K
13.17%
jan 1, 1988
131.692K
+11.448K
9.52%
jan 1, 1989
138.391K
+6.699K
5.09%
jan 1, 1990
146.193K
+7.802K
5.64%
jan 1, 1991
201.542K
+55.349K
37.86%
jan 1, 1992
198.479K
-3.063K
-1.52%
jan 1, 1993
162.967K
-35.512K
-17.89%
jan 1, 1994
182.909K
+19.942K
12.24%
jan 1, 1995
203.362K
+20.453K
11.18%
jan 1, 1996
193.283K
-10.079K
-4.96%
jan 1, 1997
181.463K
-11.819K
-6.12%
jan 1, 1998
161.589K
-19.875K
-10.95%
jan 1, 1999
173.155K
+11.566K
7.16%
jan 1, 2000
205.927K
+32.773K
18.93%
jan 1, 2001
215.799K
+9.872K
4.79%
jan 1, 2002
164.76K
-51.039K
-23.65%
jan 1, 2003
145.164K
-19.596K
-11.89%
jan 1, 2004
120.532K
-24.632K
-16.97%
jan 1, 2005
127.297K
+6.765K
5.61%
jan 1, 2006
147.92K
+20.623K
16.2%
jan 1, 2007
159.266K
+11.346K
7.67%
jan 1, 2008
132.282K
-26.984K
-16.94%
jan 1, 2009
136.109K
+3.827K
2.89%
jan 1, 2010
134.157K
-1.952K
-1.43%
jan 1, 2011
140.585K
+6.428K
4.79%
jan 1, 2012
181.569K
+40.984K
29.15%
jan 1, 2013
158.919K
-22.65K
-12.47%
jan 1, 2014
163.302K
+4.383K
2.76%
jan 1, 2015
168.385K
+5.083K
3.11%
Ranking of countries by current statistics by years


Comments: