29
/
en
AIzaSyAYiBZKx7MnpbEhh9jyipgxe19OcubqV5w
April 1, 2024
35571
High income
HIC
false
2
1
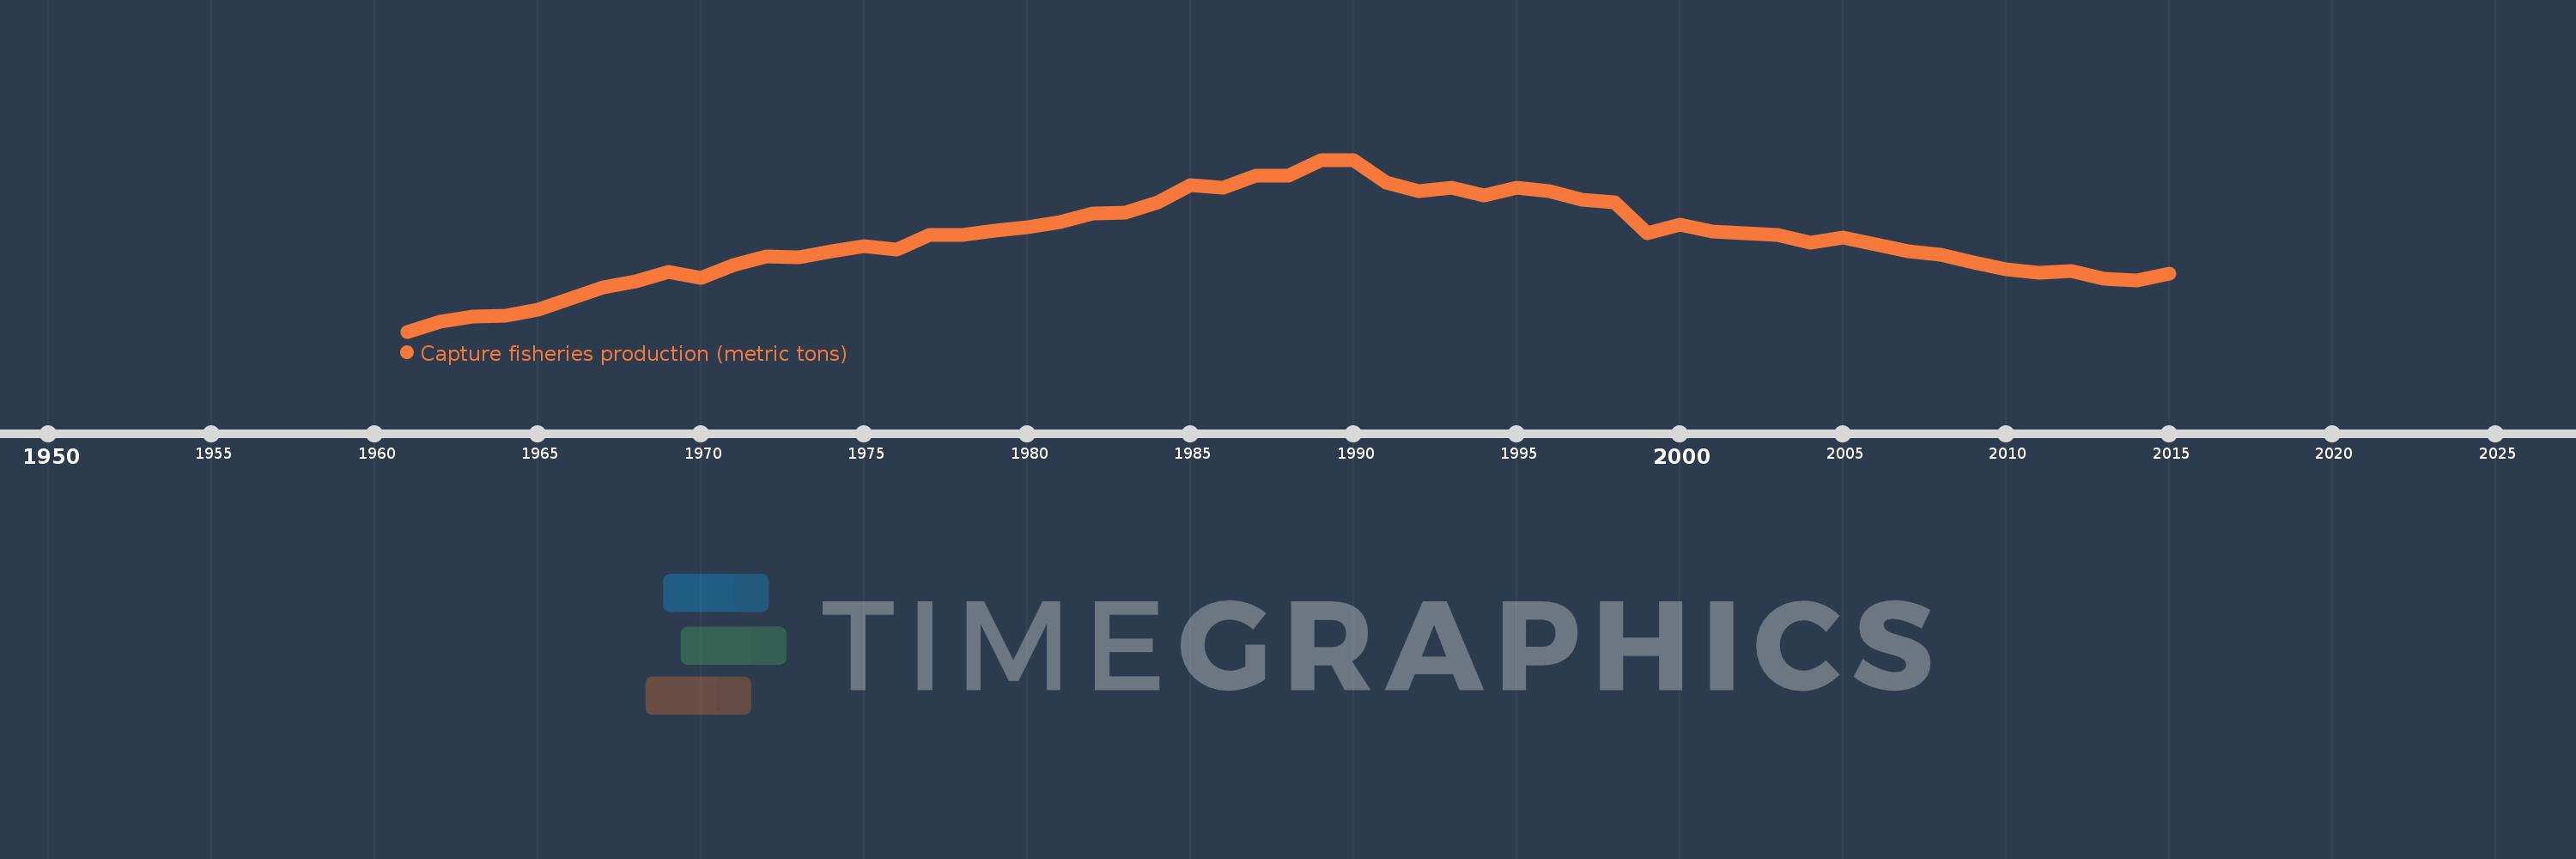
Capture fisheries production (metric tons)
2015,2014,2013,2012,2011,2010,2009,2008,2007,2006,2005,2004,2003,2002,2001,2000,1999,1998,1997,1996,1995,1994,1993,1992,1991,1990,1989,1988,1987,1986,1985,1984,1983,1982,1981,1980,1979,1978,1977,1976,1975,1974,1973,1972,1971,1970,1969,1968,1967,1966,1965,1964,1963,1962,1961
This statistics in other country:
AfghanistanAlbaniaAlgeriaAmerican SamoaAngolaAntigua and BarbudaArab WorldArgentinaArmeniaArubaAustraliaAustriaAzerbaijanBahamas, TheBahrainBangladeshBarbadosBelarusBelgiumBelizeBeninBermudaBhutanBoliviaBosnia and HerzegovinaBotswanaBrazilBritish Virgin IslandsBrunei DarussalamBulgariaBurkina FasoBurundiCabo VerdeCambodiaCameroonCanadaCaribbean small statesCayman IslandsCentral African RepublicCentral Europe and the BalticsChadChannel IslandsChileChinaColombiaComorosCongo, Dem. Rep.Congo, Rep.Costa RicaCote d'IvoireCroatiaCubaCuracaoCyprusCzech RepublicDenmarkDjiboutiDominicaDominican RepublicEarly-demographic dividendEast Asia & PacificEast Asia & Pacific (excluding high income)East Asia & Pacific (IDA & IBRD countries)EcuadorEgypt, Arab Rep.El SalvadorEquatorial GuineaEritreaEstoniaEthiopiaEuro areaEurope & Central AsiaEurope & Central Asia (excluding high income)Europe & Central Asia (IDA & IBRD countries)European UnionFaroe IslandsFijiFinlandFragile and conflict affected situationsFranceFrench PolynesiaGabonGambia, TheGeorgiaGermanyGhanaGreeceGreenlandGrenadaGuamGuatemalaGuineaGuinea-BissauGuyanaHaitiHeavily indebted poor countries (HIPC)High incomeHondurasHong Kong SAR, ChinaHungaryIBRD onlyIcelandIDA & IBRD totalIDA blendIDA onlyIDA totalIndiaIndonesiaIran, Islamic Rep.IraqIrelandIsle of ManIsraelItalyJamaicaJapanJordanKazakhstanKenyaKiribatiKorea, Dem. People’s Rep.Korea, Rep.KuwaitKyrgyz RepublicLao PDRLate-demographic dividendLatin America & Caribbean Latin America & Caribbean (excluding high income)Latin America & the Caribbean (IDA & IBRD countries)LatviaLeast developed countries: UN classificationLebanonLesothoLiberiaLibyaLithuaniaLow & middle incomeLow incomeLower middle incomeMacao SAR, ChinaMacedonia, FYRMadagascarMalawiMalaysiaMaldivesMaliMaltaMarshall IslandsMauritaniaMauritiusMexicoMicronesia, Fed. Sts.Middle East & North AfricaMiddle East & North Africa (excluding high income)Middle East & North Africa (IDA & IBRD countries)Middle incomeMoldovaMonacoMongoliaMontenegroMoroccoMozambiqueMyanmarNamibiaNauruNepalNetherlandsNew CaledoniaNew ZealandNicaraguaNigerNigeriaNorth AmericaNorthern Mariana IslandsNorwayOECD membersOmanOther small statesPacific island small statesPakistanPalauPanamaPapua New GuineaParaguayPeruPhilippinesPolandPortugalPost-demographic dividendPre-demographic dividendPuerto RicoQatarRomaniaRussian FederationRwandaSamoaSao Tome and PrincipeSaudi ArabiaSenegalSerbiaSeychellesSierra LeoneSingaporeSint Maarten (Dutch part)Slovak RepublicSloveniaSmall statesSolomon IslandsSomaliaSouth AfricaSouth AsiaSouth Asia (IDA & IBRD)South SudanSpainSri LankaSt. Kitts and NevisSt. LuciaSt. Martin (French part)St. Vincent and the GrenadinesSub-Saharan Africa Sub-Saharan Africa (excluding high income)Sub-Saharan Africa (IDA & IBRD countries)SudanSurinameSwazilandSwedenSwitzerlandSyrian Arab RepublicTajikistanTanzaniaThailandTimor-LesteTogoTongaTrinidad and TobagoTunisiaTurkeyTurkmenistanTurks and Caicos IslandsTuvaluUgandaUkraineUnited Arab EmiratesUnited KingdomUnited StatesUpper middle incomeUruguayUzbekistanVanuatuVenezuela, RBVietnamVirgin Islands (U.S.)West Bank and GazaWorldYemen, Rep.ZambiaZimbabwe Timeline:
This timeline shows a graph from 1961 to 2015 of High income. No data until 1960. Number of actual observations by date: 55.
Source name:
World Development Indicators
Source organization:
Food and Agriculture Organization.
Categories, topics:
Environment
Last updated:
apr 23, 2017
Indicators value changes by year
Minimum:
18.443 mln
jan 1, 1961
Maximum:
42.138 mln
jan 1, 1989
At the date of observation
Value
Absolute change
Change from previous value
jan 1, 1961
18.443 mln
+18.443 mln
0.0%
jan 1, 1962
19.801 mln
+1.357 mln
7.36%
jan 1, 1963
20.496 mln
+695.643K
3.51%
jan 1, 1964
20.649 mln
+152.763K
0.75%
jan 1, 1965
21.478 mln
+828.934K
4.01%
jan 1, 1966
22.997 mln
+1.519 mln
7.07%
jan 1, 1967
24.591 mln
+1.594 mln
6.93%
jan 1, 1968
25.387 mln
+796.117K
3.24%
jan 1, 1969
26.704 mln
+1.318 mln
5.19%
jan 1, 1970
25.814 mln
-890.443K
-3.33%
jan 1, 1971
27.58 mln
+1.766 mln
6.84%
jan 1, 1972
28.809 mln
+1.229 mln
4.46%
jan 1, 1973
28.652 mln
-156.562K
-0.54%
jan 1, 1974
29.466 mln
+813.606K
2.84%
jan 1, 1975
30.262 mln
+796.354K
2.7%
jan 1, 1976
29.74 mln
-522.199K
-1.73%
jan 1, 1977
31.826 mln
+2.086 mln
7.01%
jan 1, 1978
31.826 mln
+514.0
0.0%
jan 1, 1979
32.348 mln
+522.096K
1.64%
jan 1, 1980
32.841 mln
+492.616K
1.52%
jan 1, 1981
33.551 mln
+710.291K
2.16%
jan 1, 1982
34.792 mln
+1.241 mln
3.7%
jan 1, 1983
34.856 mln
+63.917K
0.18%
jan 1, 1984
36.3 mln
+1.443 mln
4.14%
jan 1, 1985
38.64 mln
+2.341 mln
6.45%
jan 1, 1986
38.314 mln
-326.05K
-0.84%
jan 1, 1987
40.001 mln
+1.687 mln
4.4%
jan 1, 1988
39.924 mln
-76.681K
-0.19%
jan 1, 1989
42.138 mln
+2.213 mln
5.54%
jan 1, 1990
42.096 mln
-41.564K
-0.1%
jan 1, 1991
38.975 mln
-3.121 mln
-7.41%
jan 1, 1992
37.771 mln
-1.203 mln
-3.09%
jan 1, 1993
38.297 mln
+525.18K
1.39%
jan 1, 1994
37.25 mln
-1.047 mln
-2.73%
jan 1, 1995
38.323 mln
+1.073 mln
2.88%
jan 1, 1996
37.766 mln
-556.443K
-1.45%
jan 1, 1997
36.57 mln
-1.196 mln
-3.17%
jan 1, 1998
36.328 mln
-242.394K
-0.66%
jan 1, 1999
31.995 mln
-4.333 mln
-11.93%
jan 1, 2000
33.234 mln
+1.239 mln
3.87%
jan 1, 2001
32.264 mln
-969.645K
-2.92%
jan 1, 2002
31.975 mln
-288.977K
-0.9%
jan 1, 2003
31.772 mln
-203.297K
-0.64%
jan 1, 2004
30.724 mln
-1.048 mln
-3.3%
jan 1, 2005
31.436 mln
+711.755K
2.32%
jan 1, 2006
30.462 mln
-973.708K
-3.1%
jan 1, 2007
29.568 mln
-894.511K
-2.94%
jan 1, 2008
29.047 mln
-520.826K
-1.76%
jan 1, 2009
27.986 mln
-1.061 mln
-3.65%
jan 1, 2010
27.009 mln
-977.086K
-3.49%
jan 1, 2011
26.592 mln
-417.462K
-1.55%
jan 1, 2012
26.767 mln
+175.4K
0.66%
jan 1, 2013
25.678 mln
-1.089 mln
-4.07%
jan 1, 2014
25.466 mln
-211.74K
-0.82%
jan 1, 2015
26.4 mln
+934.233K
3.67%
Ranking of countries by current statistics by years


Comments: