29
/
en
AIzaSyAYiBZKx7MnpbEhh9jyipgxe19OcubqV5w
April 1, 2024
28908
East Asia & Pacific (IDA & IBRD countries)
TEA
false
2
1
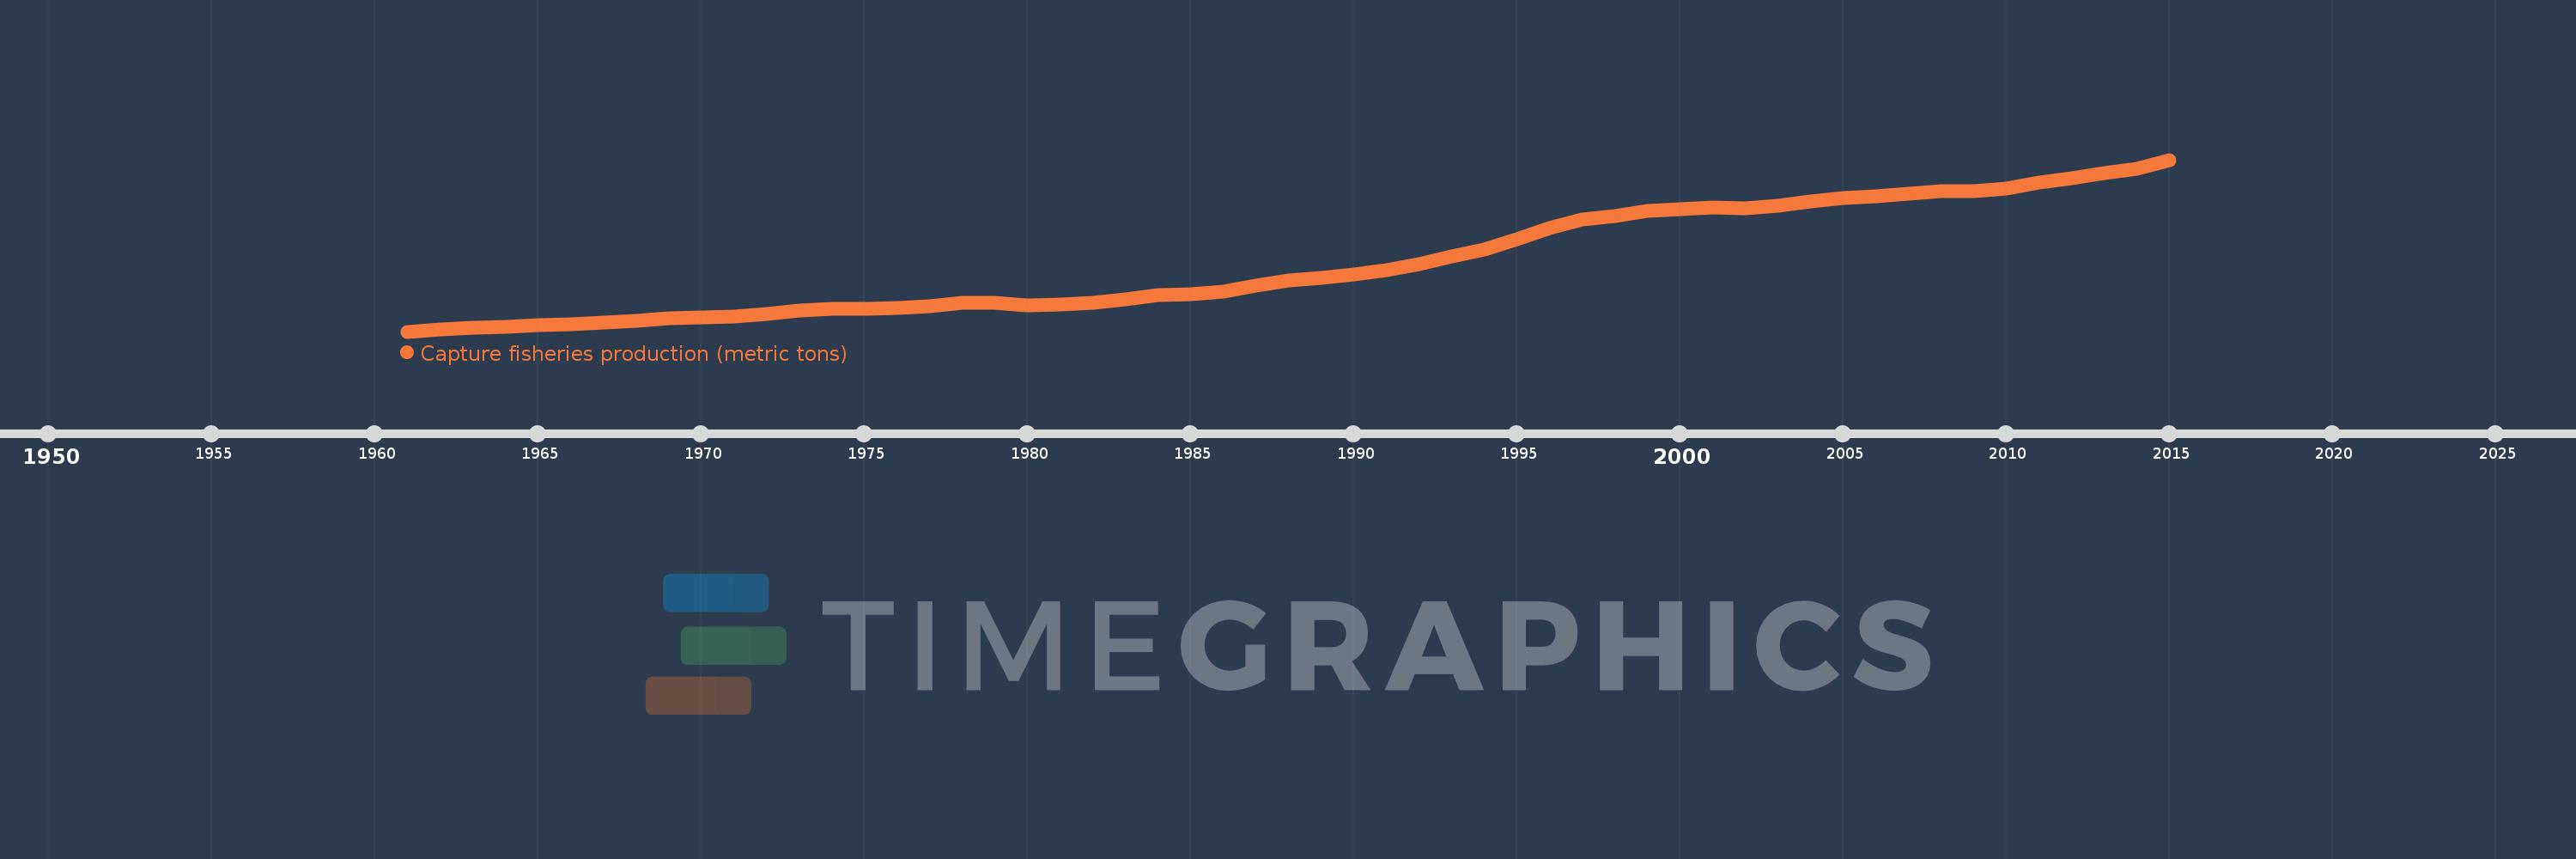
Capture fisheries production (metric tons)
2015,2014,2013,2012,2011,2010,2009,2008,2007,2006,2005,2004,2003,2002,2001,2000,1999,1998,1997,1996,1995,1994,1993,1992,1991,1990,1989,1988,1987,1986,1985,1984,1983,1982,1981,1980,1979,1978,1977,1976,1975,1974,1973,1972,1971,1970,1969,1968,1967,1966,1965,1964,1963,1962,1961
This statistics in other country:
AfghanistanAlbaniaAlgeriaAmerican SamoaAngolaAntigua and BarbudaArab WorldArgentinaArmeniaArubaAustraliaAustriaAzerbaijanBahamas, TheBahrainBangladeshBarbadosBelarusBelgiumBelizeBeninBermudaBhutanBoliviaBosnia and HerzegovinaBotswanaBrazilBritish Virgin IslandsBrunei DarussalamBulgariaBurkina FasoBurundiCabo VerdeCambodiaCameroonCanadaCaribbean small statesCayman IslandsCentral African RepublicCentral Europe and the BalticsChadChannel IslandsChileChinaColombiaComorosCongo, Dem. Rep.Congo, Rep.Costa RicaCote d'IvoireCroatiaCubaCuracaoCyprusCzech RepublicDenmarkDjiboutiDominicaDominican RepublicEarly-demographic dividendEast Asia & PacificEast Asia & Pacific (excluding high income)East Asia & Pacific (IDA & IBRD countries)EcuadorEgypt, Arab Rep.El SalvadorEquatorial GuineaEritreaEstoniaEthiopiaEuro areaEurope & Central AsiaEurope & Central Asia (excluding high income)Europe & Central Asia (IDA & IBRD countries)European UnionFaroe IslandsFijiFinlandFragile and conflict affected situationsFranceFrench PolynesiaGabonGambia, TheGeorgiaGermanyGhanaGreeceGreenlandGrenadaGuamGuatemalaGuineaGuinea-BissauGuyanaHaitiHeavily indebted poor countries (HIPC)High incomeHondurasHong Kong SAR, ChinaHungaryIBRD onlyIcelandIDA & IBRD totalIDA blendIDA onlyIDA totalIndiaIndonesiaIran, Islamic Rep.IraqIrelandIsle of ManIsraelItalyJamaicaJapanJordanKazakhstanKenyaKiribatiKorea, Dem. People’s Rep.Korea, Rep.KuwaitKyrgyz RepublicLao PDRLate-demographic dividendLatin America & Caribbean Latin America & Caribbean (excluding high income)Latin America & the Caribbean (IDA & IBRD countries)LatviaLeast developed countries: UN classificationLebanonLesothoLiberiaLibyaLithuaniaLow & middle incomeLow incomeLower middle incomeMacao SAR, ChinaMacedonia, FYRMadagascarMalawiMalaysiaMaldivesMaliMaltaMarshall IslandsMauritaniaMauritiusMexicoMicronesia, Fed. Sts.Middle East & North AfricaMiddle East & North Africa (excluding high income)Middle East & North Africa (IDA & IBRD countries)Middle incomeMoldovaMonacoMongoliaMontenegroMoroccoMozambiqueMyanmarNamibiaNauruNepalNetherlandsNew CaledoniaNew ZealandNicaraguaNigerNigeriaNorth AmericaNorthern Mariana IslandsNorwayOECD membersOmanOther small statesPacific island small statesPakistanPalauPanamaPapua New GuineaParaguayPeruPhilippinesPolandPortugalPost-demographic dividendPre-demographic dividendPuerto RicoQatarRomaniaRussian FederationRwandaSamoaSao Tome and PrincipeSaudi ArabiaSenegalSerbiaSeychellesSierra LeoneSingaporeSint Maarten (Dutch part)Slovak RepublicSloveniaSmall statesSolomon IslandsSomaliaSouth AfricaSouth AsiaSouth Asia (IDA & IBRD)South SudanSpainSri LankaSt. Kitts and NevisSt. LuciaSt. Martin (French part)St. Vincent and the GrenadinesSub-Saharan Africa Sub-Saharan Africa (excluding high income)Sub-Saharan Africa (IDA & IBRD countries)SudanSurinameSwazilandSwedenSwitzerlandSyrian Arab RepublicTajikistanTanzaniaThailandTimor-LesteTogoTongaTrinidad and TobagoTunisiaTurkeyTurkmenistanTurks and Caicos IslandsTuvaluUgandaUkraineUnited Arab EmiratesUnited KingdomUnited StatesUpper middle incomeUruguayUzbekistanVanuatuVenezuela, RBVietnamVirgin Islands (U.S.)West Bank and GazaWorldYemen, Rep.ZambiaZimbabwe Timeline:
This timeline shows a graph from 1961 to 2015 of East Asia & Pacific (IDA & IBRD countries). No data until 1960. Number of actual observations by date: 55.
Source name:
World Development Indicators
Source organization:
Food and Agriculture Organization.
Categories, topics:
Environment
Last updated:
apr 23, 2017
Indicators value changes by year
Minimum:
4.552 mln
jan 1, 1961
Maximum:
37.833 mln
jan 1, 2015
At the date of observation
Value
Absolute change
Change from previous value
jan 1, 1961
4.552 mln
+4.552 mln
0.0%
jan 1, 1962
4.977 mln
+424.394K
9.32%
jan 1, 1963
5.308 mln
+330.728K
6.65%
jan 1, 1964
5.494 mln
+186.405K
3.51%
jan 1, 1965
5.753 mln
+259.003K
4.71%
jan 1, 1966
6.042 mln
+289.2K
5.03%
jan 1, 1967
6.347 mln
+305.172K
5.05%
jan 1, 1968
6.603 mln
+256.002K
4.03%
jan 1, 1969
7.143 mln
+539.112K
8.16%
jan 1, 1970
7.313 mln
+170.824K
2.39%
jan 1, 1971
7.415 mln
+101.672K
1.39%
jan 1, 1972
7.944 mln
+529.1K
7.14%
jan 1, 1973
8.597 mln
+653.314K
8.22%
jan 1, 1974
8.902 mln
+304.807K
3.55%
jan 1, 1975
8.948 mln
+46.202K
0.52%
jan 1, 1976
9.113 mln
+164.452K
1.84%
jan 1, 1977
9.425 mln
+311.896K
3.42%
jan 1, 1978
10.202 mln
+777.674K
8.25%
jan 1, 1979
10.111 mln
-91.09K
-0.89%
jan 1, 1980
9.695 mln
-416.331K
-4.12%
jan 1, 1981
9.713 mln
+18.308K
0.19%
jan 1, 1982
10.14 mln
+426.446K
4.39%
jan 1, 1983
10.8 mln
+660.136K
6.51%
jan 1, 1984
11.633 mln
+833.57K
7.72%
jan 1, 1985
11.771 mln
+137.944K
1.19%
jan 1, 1986
12.261 mln
+489.9K
4.16%
jan 1, 1987
13.454 mln
+1.193 mln
9.73%
jan 1, 1988
14.524 mln
+1.07 mln
7.95%
jan 1, 1989
14.899 mln
+375.367K
2.58%
jan 1, 1990
15.647 mln
+747.864K
5.02%
jan 1, 1991
16.463 mln
+816.29K
5.22%
jan 1, 1992
17.598 mln
+1.135 mln
6.89%
jan 1, 1993
19.116 mln
+1.518 mln
8.62%
jan 1, 1994
20.488 mln
+1.372 mln
7.18%
jan 1, 1995
22.498 mln
+2.009 mln
9.81%
jan 1, 1996
24.581 mln
+2.084 mln
9.26%
jan 1, 1997
26.202 mln
+1.621 mln
6.59%
jan 1, 1998
26.969 mln
+767.078K
2.93%
jan 1, 1999
27.976 mln
+1.007 mln
3.73%
jan 1, 2000
28.334 mln
+357.785K
1.28%
jan 1, 2001
28.537 mln
+202.78K
0.72%
jan 1, 2002
28.476 mln
-60.729K
-0.21%
jan 1, 2003
28.888 mln
+411.946K
1.45%
jan 1, 2004
29.695 mln
+806.546K
2.79%
jan 1, 2005
30.455 mln
+760.215K
2.56%
jan 1, 2006
30.682 mln
+227.147K
0.75%
jan 1, 2007
31.224 mln
+542.062K
1.77%
jan 1, 2008
31.708 mln
+483.919K
1.55%
jan 1, 2009
31.681 mln
-27.536K
-0.09%
jan 1, 2010
32.317 mln
+636.345K
2.01%
jan 1, 2011
33.471 mln
+1.154 mln
3.57%
jan 1, 2012
34.275 mln
+803.317K
2.4%
jan 1, 2013
35.208 mln
+933.042K
2.72%
jan 1, 2014
36.12 mln
+912.321K
2.59%
jan 1, 2015
37.833 mln
+1.713 mln
4.74%
Ranking of countries by current statistics by years


Comments: