29
/
en
AIzaSyAYiBZKx7MnpbEhh9jyipgxe19OcubqV5w
April 1, 2024
245280
South Africa
ZAF
true
2
1
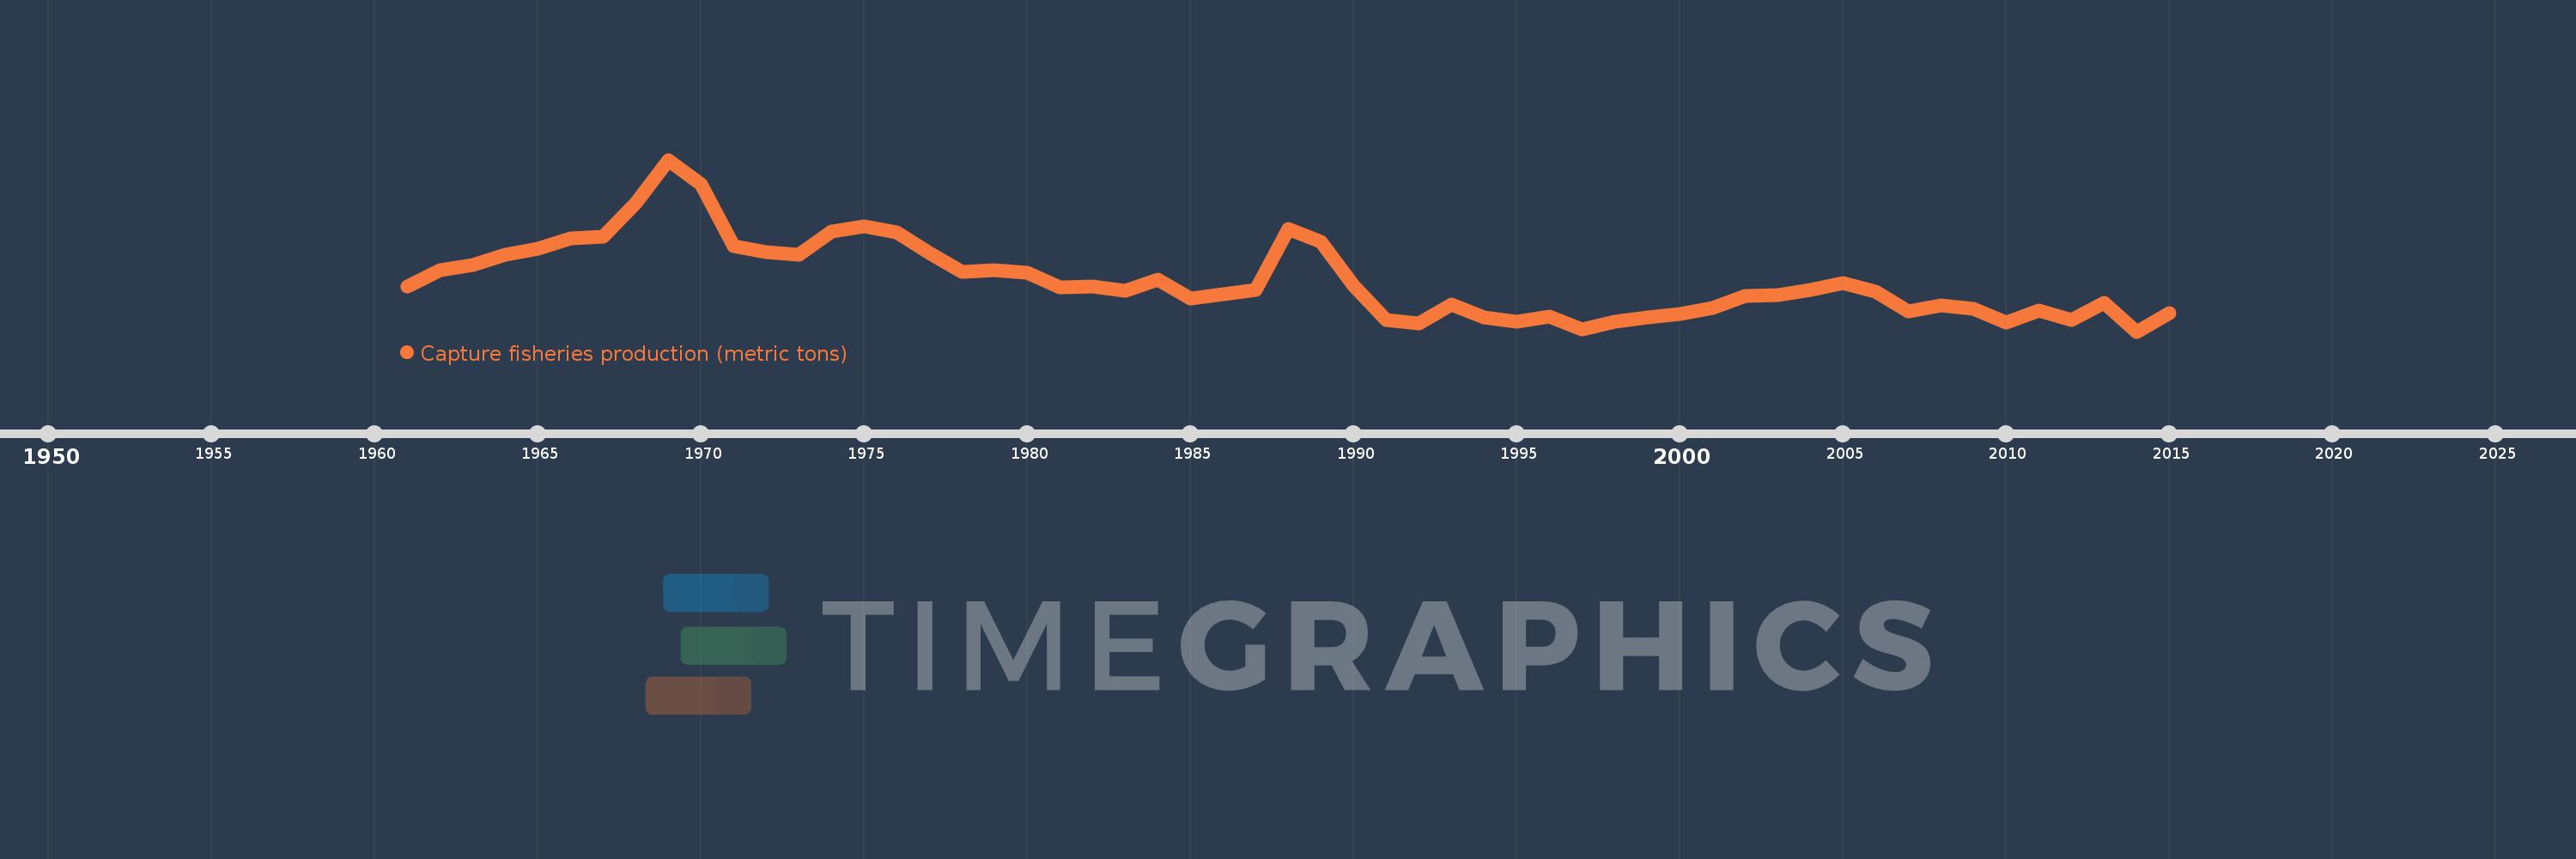
Capture fisheries production (metric tons)
2015,2014,2013,2012,2011,2010,2009,2008,2007,2006,2005,2004,2003,2002,2001,2000,1999,1998,1997,1996,1995,1994,1993,1992,1991,1990,1989,1988,1987,1986,1985,1984,1983,1982,1981,1980,1979,1978,1977,1976,1975,1974,1973,1972,1971,1970,1969,1968,1967,1966,1965,1964,1963,1962,1961
This statistics in other country:
AfghanistanAlbaniaAlgeriaAmerican SamoaAngolaAntigua and BarbudaArab WorldArgentinaArmeniaArubaAustraliaAustriaAzerbaijanBahamas, TheBahrainBangladeshBarbadosBelarusBelgiumBelizeBeninBermudaBhutanBoliviaBosnia and HerzegovinaBotswanaBrazilBritish Virgin IslandsBrunei DarussalamBulgariaBurkina FasoBurundiCabo VerdeCambodiaCameroonCanadaCaribbean small statesCayman IslandsCentral African RepublicCentral Europe and the BalticsChadChannel IslandsChileChinaColombiaComorosCongo, Dem. Rep.Congo, Rep.Costa RicaCote d'IvoireCroatiaCubaCuracaoCyprusCzech RepublicDenmarkDjiboutiDominicaDominican RepublicEarly-demographic dividendEast Asia & PacificEast Asia & Pacific (excluding high income)East Asia & Pacific (IDA & IBRD countries)EcuadorEgypt, Arab Rep.El SalvadorEquatorial GuineaEritreaEstoniaEthiopiaEuro areaEurope & Central AsiaEurope & Central Asia (excluding high income)Europe & Central Asia (IDA & IBRD countries)European UnionFaroe IslandsFijiFinlandFragile and conflict affected situationsFranceFrench PolynesiaGabonGambia, TheGeorgiaGermanyGhanaGreeceGreenlandGrenadaGuamGuatemalaGuineaGuinea-BissauGuyanaHaitiHeavily indebted poor countries (HIPC)High incomeHondurasHong Kong SAR, ChinaHungaryIBRD onlyIcelandIDA & IBRD totalIDA blendIDA onlyIDA totalIndiaIndonesiaIran, Islamic Rep.IraqIrelandIsle of ManIsraelItalyJamaicaJapanJordanKazakhstanKenyaKiribatiKorea, Dem. People’s Rep.Korea, Rep.KuwaitKyrgyz RepublicLao PDRLate-demographic dividendLatin America & Caribbean Latin America & Caribbean (excluding high income)Latin America & the Caribbean (IDA & IBRD countries)LatviaLeast developed countries: UN classificationLebanonLesothoLiberiaLibyaLithuaniaLow & middle incomeLow incomeLower middle incomeMacao SAR, ChinaMacedonia, FYRMadagascarMalawiMalaysiaMaldivesMaliMaltaMarshall IslandsMauritaniaMauritiusMexicoMicronesia, Fed. Sts.Middle East & North AfricaMiddle East & North Africa (excluding high income)Middle East & North Africa (IDA & IBRD countries)Middle incomeMoldovaMonacoMongoliaMontenegroMoroccoMozambiqueMyanmarNamibiaNauruNepalNetherlandsNew CaledoniaNew ZealandNicaraguaNigerNigeriaNorth AmericaNorthern Mariana IslandsNorwayOECD membersOmanOther small statesPacific island small statesPakistanPalauPanamaPapua New GuineaParaguayPeruPhilippinesPolandPortugalPost-demographic dividendPre-demographic dividendPuerto RicoQatarRomaniaRussian FederationRwandaSamoaSao Tome and PrincipeSaudi ArabiaSenegalSerbiaSeychellesSierra LeoneSingaporeSint Maarten (Dutch part)Slovak RepublicSloveniaSmall statesSolomon IslandsSomaliaSouth AfricaSouth AsiaSouth Asia (IDA & IBRD)South SudanSpainSri LankaSt. Kitts and NevisSt. LuciaSt. Martin (French part)St. Vincent and the GrenadinesSub-Saharan Africa Sub-Saharan Africa (excluding high income)Sub-Saharan Africa (IDA & IBRD countries)SudanSurinameSwazilandSwedenSwitzerlandSyrian Arab RepublicTajikistanTanzaniaThailandTimor-LesteTogoTongaTrinidad and TobagoTunisiaTurkeyTurkmenistanTurks and Caicos IslandsTuvaluUgandaUkraineUnited Arab EmiratesUnited KingdomUnited StatesUpper middle incomeUruguayUzbekistanVanuatuVenezuela, RBVietnamVirgin Islands (U.S.)West Bank and GazaWorldYemen, Rep.ZambiaZimbabwe Timeline:
This timeline shows a graph from 1961 to 2015 of South Africa. No data until 1960. Number of actual observations by date: 55.
Source name:
World Development Indicators
Source organization:
Food and Agriculture Organization.
Categories, topics:
Environment
Last updated:
apr 23, 2017
Indicators value changes by year
Minimum:
430.53K
jan 1, 2014
Maximum:
2.133 mln
jan 1, 1969
At the date of observation
Value
Absolute change
Change from previous value
jan 1, 1961
879.0K
+879.0K
0.0%
jan 1, 1962
1.037 mln
+157.6K
17.93%
jan 1, 1963
1.088 mln
+51.7K
4.99%
jan 1, 1964
1.195 mln
+106.814K
9.81%
jan 1, 1965
1.253 mln
+58.092K
4.86%
jan 1, 1966
1.351 mln
+98.103K
7.83%
jan 1, 1967
1.369 mln
+17.983K
1.33%
jan 1, 1968
1.702 mln
+332.608K
24.29%
jan 1, 1969
2.133 mln
+430.7K
25.31%
jan 1, 1970
1.887 mln
-245.5K
-11.51%
jan 1, 1971
1.278 mln
-609.15K
-32.28%
jan 1, 1972
1.215 mln
-63.4K
-4.96%
jan 1, 1973
1.188 mln
-26.546K
-2.19%
jan 1, 1974
1.424 mln
+235.821K
19.85%
jan 1, 1975
1.477 mln
+53.462K
3.75%
jan 1, 1976
1.414 mln
-63.343K
-4.29%
jan 1, 1977
1.21 mln
-203.644K
-14.4%
jan 1, 1978
1.02 mln
-189.8K
-15.68%
jan 1, 1979
1.039 mln
+18.969K
1.86%
jan 1, 1980
1.011 mln
-28.274K
-2.72%
jan 1, 1981
866.037K
-145.158K
-14.36%
jan 1, 1982
879.395K
+13.358K
1.54%
jan 1, 1983
838.116K
-41.279K
-4.69%
jan 1, 1984
948.726K
+110.61K
13.2%
jan 1, 1985
757.915K
-190.811K
-20.11%
jan 1, 1986
798.408K
+40.493K
5.34%
jan 1, 1987
842.825K
+44.417K
5.56%
jan 1, 1988
1.446 mln
+603.3K
71.58%
jan 1, 1989
1.323 mln
-123.167K
-8.52%
jan 1, 1990
887.827K
-435.131K
-32.89%
jan 1, 1991
545.583K
-342.244K
-38.55%
jan 1, 1992
507.296K
-38.287K
-7.02%
jan 1, 1993
701.603K
+194.307K
38.3%
jan 1, 1994
570.334K
-131.269K
-18.71%
jan 1, 1995
527.825K
-42.509K
-7.45%
jan 1, 1996
582.39K
+54.565K
10.34%
jan 1, 1997
450.18K
-132.21K
-22.7%
jan 1, 1998
525.944K
+75.764K
16.83%
jan 1, 1999
574.308K
+48.364K
9.2%
jan 1, 2000
605.317K
+31.009K
5.4%
jan 1, 2001
664.095K
+58.778K
9.71%
jan 1, 2002
782.64K
+118.545K
17.85%
jan 1, 2003
793.541K
+10.901K
1.39%
jan 1, 2004
840.277K
+46.736K
5.89%
jan 1, 2005
910.845K
+70.568K
8.4%
jan 1, 2006
824.285K
-86.56K
-9.5%
jan 1, 2007
628.393K
-195.892K
-23.77%
jan 1, 2008
690.385K
+61.992K
9.87%
jan 1, 2009
655.447K
-34.938K
-5.06%
jan 1, 2010
523.032K
-132.415K
-20.2%
jan 1, 2011
640.089K
+117.057K
22.38%
jan 1, 2012
544.333K
-95.756K
-14.96%
jan 1, 2013
718.995K
+174.662K
32.09%
jan 1, 2014
430.53K
-288.465K
-40.12%
jan 1, 2015
609.513K
+178.983K
41.57%
Ranking of countries by current statistics by years


Comments: