29
/
en
AIzaSyAYiBZKx7MnpbEhh9jyipgxe19OcubqV5w
April 1, 2024
72784
Australia
AUS
true
2
1
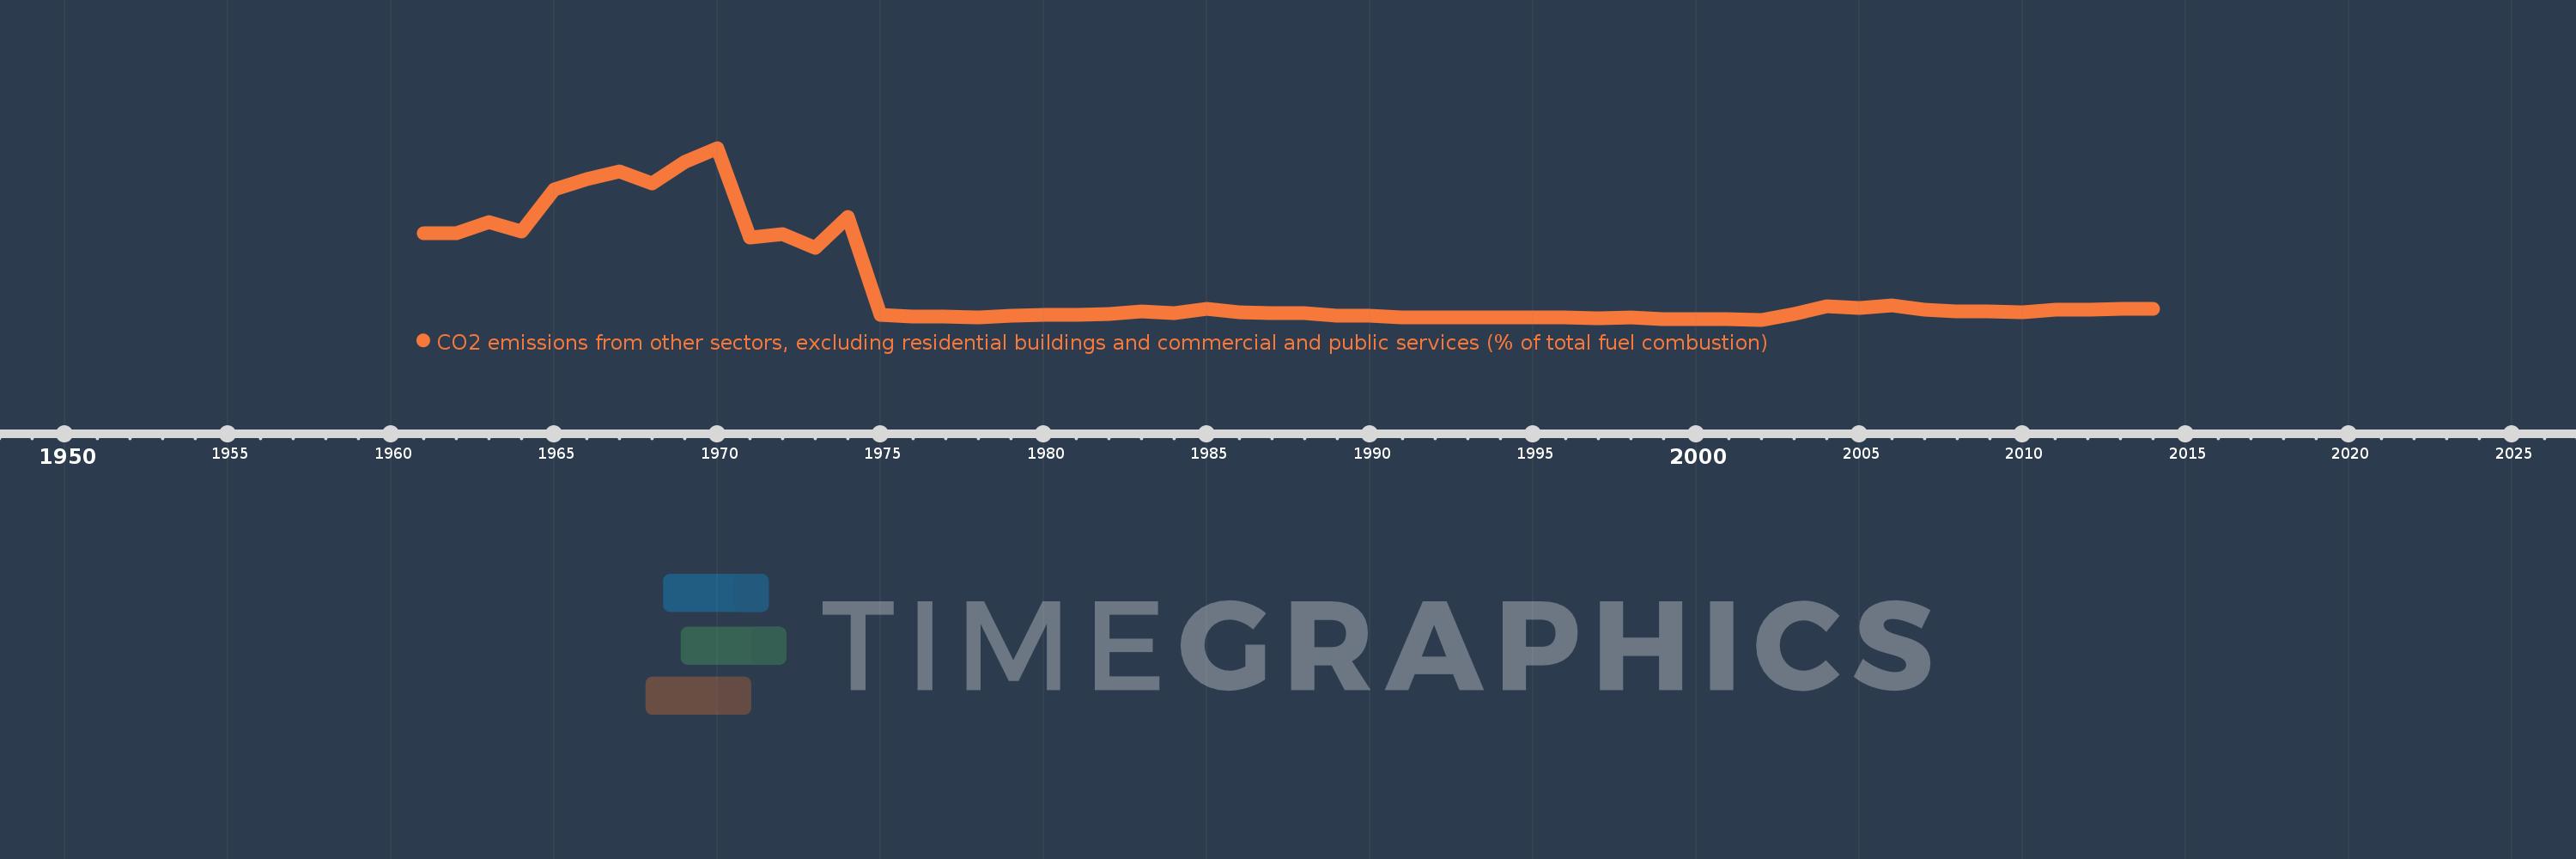
CO2 emissions from other sectors, excluding residential buildings and commercial and public services (% of total fuel combustion)
2014,2013,2012,2011,2010,2009,2008,2007,2006,2005,2004,2003,2002,2001,2000,1999,1998,1997,1996,1995,1994,1993,1992,1991,1990,1989,1988,1987,1986,1985,1984,1983,1982,1981,1980,1979,1978,1977,1976,1975,1974,1973,1972,1971,1970,1969,1968,1967,1966,1965,1964,1963,1962,1961
This statistics in other country:
AlbaniaAlgeriaAngolaArab WorldArgentinaArmeniaAustraliaAustriaAzerbaijanBahrainBangladeshBelarusBelgiumBeninBoliviaBosnia and HerzegovinaBotswanaBrazilBrunei DarussalamBulgariaCambodiaCameroonCanadaCaribbean small statesCentral Europe and the BalticsChileChinaColombiaCongo, Dem. Rep.Congo, Rep.Costa RicaCote d'IvoireCroatiaCubaCuracaoCyprusCzech RepublicDenmarkDominican RepublicEarly-demographic dividendEast Asia & PacificEast Asia & Pacific (excluding high income)East Asia & Pacific (IDA & IBRD countries)EcuadorEgypt, Arab Rep.El SalvadorEritreaEstoniaEthiopiaEuro areaEurope & Central AsiaEurope & Central Asia (excluding high income)Europe & Central Asia (IDA & IBRD countries)European UnionFinlandFragile and conflict affected situationsFranceGabonGeorgiaGermanyGhanaGibraltarGreeceGuatemalaHaitiHeavily indebted poor countries (HIPC)High incomeHondurasHong Kong SAR, ChinaHungaryIBRD onlyIcelandIDA & IBRD totalIDA blendIDA onlyIDA totalIndiaIndonesiaIran, Islamic Rep.IraqIrelandIsraelItalyJamaicaJapanJordanKazakhstanKenyaKorea, Dem. People’s Rep.Korea, Rep.KosovoKuwaitKyrgyz RepublicLate-demographic dividendLatin America & Caribbean Latin America & Caribbean (excluding high income)Latin America & the Caribbean (IDA & IBRD countries)LatviaLeast developed countries: UN classificationLebanonLibyaLithuaniaLow & middle incomeLow incomeLower middle incomeLuxembourgMacedonia, FYRMalaysiaMaltaMauritiusMexicoMiddle East & North AfricaMiddle East & North Africa (excluding high income)Middle East & North Africa (IDA & IBRD countries)Middle incomeMoldovaMongoliaMontenegroMoroccoMozambiqueMyanmarNamibiaNepalNetherlandsNew ZealandNicaraguaNigerNigeriaNorth AmericaNorwayOECD membersOmanOther small statesPakistanPanamaParaguayPeruPhilippinesPolandPortugalPost-demographic dividendPre-demographic dividendQatarRomaniaRussian FederationSaudi ArabiaSenegalSerbiaSingaporeSlovak RepublicSloveniaSmall statesSouth AfricaSouth AsiaSouth Asia (IDA & IBRD)South SudanSpainSri LankaSub-Saharan Africa Sub-Saharan Africa (excluding high income)Sub-Saharan Africa (IDA & IBRD countries)SudanSwedenSwitzerlandSyrian Arab RepublicTajikistanTanzaniaThailandTogoTrinidad and TobagoTunisiaTurkeyTurkmenistanUkraineUnited Arab EmiratesUnited KingdomUnited StatesUpper middle incomeUruguayUzbekistanVenezuela, RBVietnamWorldYemen, Rep.ZambiaZimbabwe Timeline:
This timeline shows a graph from 1961 to 2014 of Australia. No data until 1960. Number of actual observations by date: 54.
Source name:
World Development Indicators
Source organization:
IEA Statistics © OECD/IEA 2014 (http://www.iea.org/stats/index.asp), subject to https://www.iea.org/t&c/termsandconditions/
Categories, topics:
Environment
Last updated:
apr 23, 2017
Indicators value changes by year
At the date of observation
Value
Absolute change
Change from previous value
jan 1, 1961
4.398
+4.398
0.0%
jan 1, 1962
4.408
+0.01
0.23%
jan 1, 1963
4.81
+0.402
9.12%
jan 1, 1964
4.471
-0.339
-7.04%
jan 1, 1965
6.011
+1.539
34.42%
jan 1, 1966
6.368
+0.358
5.95%
jan 1, 1967
6.663
+0.294
4.62%
jan 1, 1968
6.217
-0.446
-6.69%
jan 1, 1969
7.006
+0.789
12.69%
jan 1, 1970
7.52
+0.515
7.35%
jan 1, 1971
4.243
-3.277
-43.57%
jan 1, 1972
4.353
+0.109
2.57%
jan 1, 1973
3.861
-0.492
-11.3%
jan 1, 1974
5.003
+1.142
29.57%
jan 1, 1975
1.403
-3.6
-71.96%
jan 1, 1976
1.36
-0.043
-3.06%
jan 1, 1977
1.364
+0.004
0.28%
jan 1, 1978
1.307
-0.057
-4.17%
jan 1, 1979
1.392
+0.085
6.53%
jan 1, 1980
1.414
+0.022
1.54%
jan 1, 1981
1.403
-0.011
-0.76%
jan 1, 1982
1.447
+0.044
3.13%
jan 1, 1983
1.544
+0.098
6.75%
jan 1, 1984
1.482
-0.062
-4.05%
jan 1, 1985
1.644
+0.162
10.93%
jan 1, 1986
1.504
-0.14
-8.53%
jan 1, 1987
1.476
-0.027
-1.82%
jan 1, 1988
1.467
-0.01
-0.65%
jan 1, 1989
1.37
-0.096
-6.56%
jan 1, 1990
1.376
+0.006
0.44%
jan 1, 1991
1.306
-0.07
-5.1%
jan 1, 1992
1.306
+0.0
0.01%
jan 1, 1993
1.305
-0.001
-0.08%
jan 1, 1994
1.331
+0.026
1.96%
jan 1, 1995
1.331
+0.0
0.02%
jan 1, 1996
1.328
-0.003
-0.22%
jan 1, 1997
1.287
-0.041
-3.1%
jan 1, 1998
1.306
+0.019
1.5%
jan 1, 1999
1.252
-0.055
-4.18%
jan 1, 2000
1.259
+0.007
0.57%
jan 1, 2001
1.255
-0.004
-0.32%
jan 1, 2002
1.234
-0.02
-1.62%
jan 1, 2003
1.445
+0.21
17.02%
jan 1, 2004
1.737
+0.292
20.23%
jan 1, 2005
1.674
-0.063
-3.62%
jan 1, 2006
1.745
+0.071
4.23%
jan 1, 2007
1.602
-0.142
-8.16%
jan 1, 2008
1.535
-0.067
-4.19%
jan 1, 2009
1.541
+0.005
0.34%
jan 1, 2010
1.516
-0.025
-1.6%
jan 1, 2011
1.595
+0.079
5.19%
jan 1, 2012
1.595
+0.001
0.05%
jan 1, 2013
1.618
+0.022
1.4%
jan 1, 2014
1.634
+0.016
0.99%
Ranking of countries by current statistics by years


Comments: