29
/
en
AIzaSyAYiBZKx7MnpbEhh9jyipgxe19OcubqV5w
April 1, 2024
216156
Pakistan
PAK
true
2
1
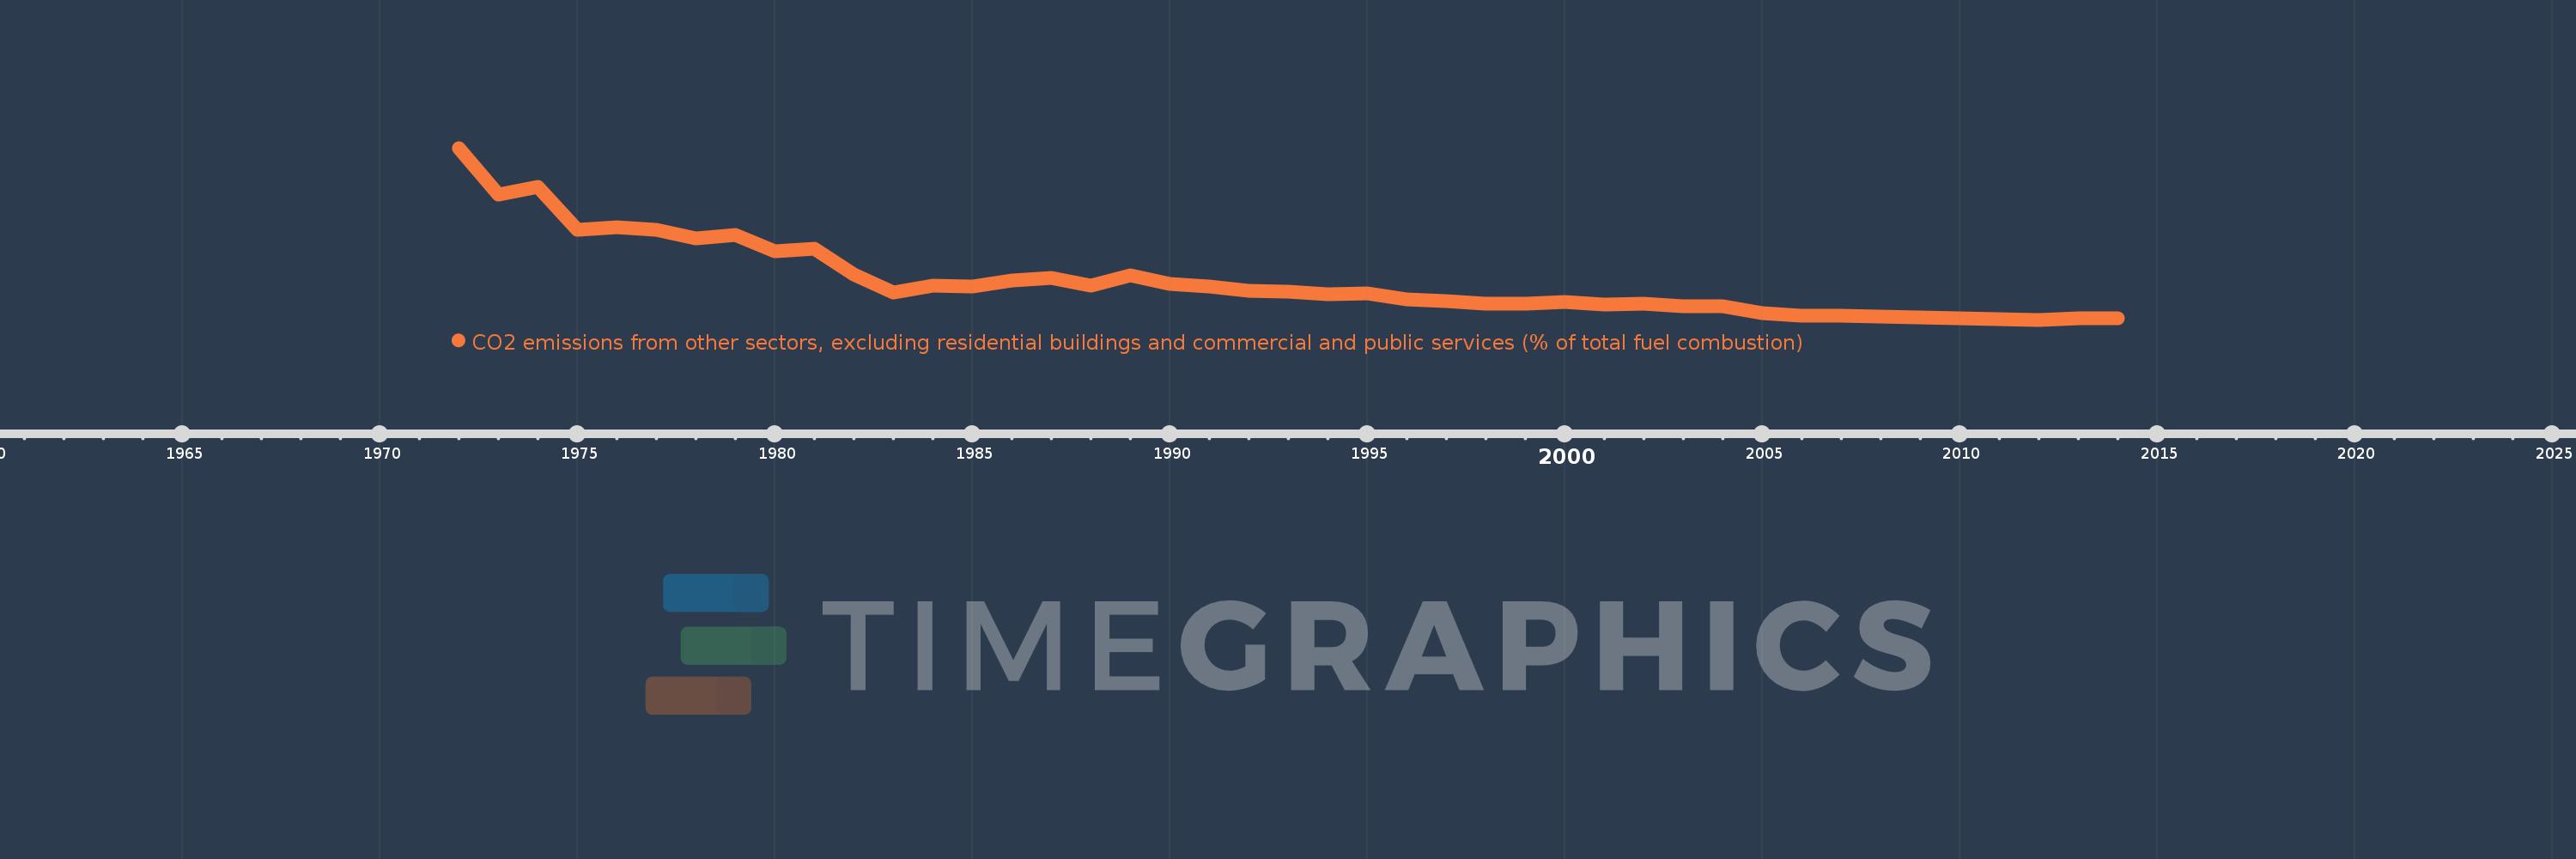
CO2 emissions from other sectors, excluding residential buildings and commercial and public services (% of total fuel combustion)
2014,2013,2012,2011,2010,2009,2008,2007,2006,2005,2004,2003,2002,2001,2000,1999,1998,1997,1996,1995,1994,1993,1992,1991,1990,1989,1988,1987,1986,1985,1984,1983,1982,1981,1980,1979,1978,1977,1976,1975,1974,1973,1972
Global statistics library →Pakistan →CO2 emissions from other sectors, excluding residential buildings and commercial and public services (% of total fuel combustion)
This statistics in other country:
AlbaniaAlgeriaAngolaArab WorldArgentinaArmeniaAustraliaAustriaAzerbaijanBahrainBangladeshBelarusBelgiumBeninBoliviaBosnia and HerzegovinaBotswanaBrazilBrunei DarussalamBulgariaCambodiaCameroonCanadaCaribbean small statesCentral Europe and the BalticsChileChinaColombiaCongo, Dem. Rep.Congo, Rep.Costa RicaCote d'IvoireCroatiaCubaCuracaoCyprusCzech RepublicDenmarkDominican RepublicEarly-demographic dividendEast Asia & PacificEast Asia & Pacific (excluding high income)East Asia & Pacific (IDA & IBRD countries)EcuadorEgypt, Arab Rep.El SalvadorEritreaEstoniaEthiopiaEuro areaEurope & Central AsiaEurope & Central Asia (excluding high income)Europe & Central Asia (IDA & IBRD countries)European UnionFinlandFragile and conflict affected situationsFranceGabonGeorgiaGermanyGhanaGibraltarGreeceGuatemalaHaitiHeavily indebted poor countries (HIPC)High incomeHondurasHong Kong SAR, ChinaHungaryIBRD onlyIcelandIDA & IBRD totalIDA blendIDA onlyIDA totalIndiaIndonesiaIran, Islamic Rep.IraqIrelandIsraelItalyJamaicaJapanJordanKazakhstanKenyaKorea, Dem. People’s Rep.Korea, Rep.KosovoKuwaitKyrgyz RepublicLate-demographic dividendLatin America & Caribbean Latin America & Caribbean (excluding high income)Latin America & the Caribbean (IDA & IBRD countries)LatviaLeast developed countries: UN classificationLebanonLibyaLithuaniaLow & middle incomeLow incomeLower middle incomeLuxembourgMacedonia, FYRMalaysiaMaltaMauritiusMexicoMiddle East & North AfricaMiddle East & North Africa (excluding high income)Middle East & North Africa (IDA & IBRD countries)Middle incomeMoldovaMongoliaMontenegroMoroccoMozambiqueMyanmarNamibiaNepalNetherlandsNew ZealandNicaraguaNigerNigeriaNorth AmericaNorwayOECD membersOmanOther small statesPakistanPanamaParaguayPeruPhilippinesPolandPortugalPost-demographic dividendPre-demographic dividendQatarRomaniaRussian FederationSaudi ArabiaSenegalSerbiaSingaporeSlovak RepublicSloveniaSmall statesSouth AfricaSouth AsiaSouth Asia (IDA & IBRD)South SudanSpainSri LankaSub-Saharan Africa Sub-Saharan Africa (excluding high income)Sub-Saharan Africa (IDA & IBRD countries)SudanSwedenSwitzerlandSyrian Arab RepublicTajikistanTanzaniaThailandTogoTrinidad and TobagoTunisiaTurkeyTurkmenistanUkraineUnited Arab EmiratesUnited KingdomUnited StatesUpper middle incomeUruguayUzbekistanVenezuela, RBVietnamWorldYemen, Rep.ZambiaZimbabwe Timeline:
This timeline shows a graph from 1972 to 2014 of Pakistan. No data until 1971. Number of actual observations by date: 43.
Source name:
World Development Indicators
Source organization:
IEA Statistics © OECD/IEA 2014 (http://www.iea.org/stats/index.asp), subject to https://www.iea.org/t&c/termsandconditions/
Categories, topics:
Environment
Last updated:
apr 23, 2017
Indicators value changes by year
At the date of observation
Value
Absolute change
Change from previous value
jan 1, 1972
8.003
+8.003
0.0%
jan 1, 1973
5.875
-2.128
-26.59%
jan 1, 1974
6.243
+0.368
6.26%
jan 1, 1975
4.29
-1.953
-31.28%
jan 1, 1976
4.404
+0.115
2.67%
jan 1, 1977
4.295
-0.109
-2.47%
jan 1, 1978
3.892
-0.404
-9.4%
jan 1, 1979
4.041
+0.15
3.85%
jan 1, 1980
3.309
-0.733
-18.13%
jan 1, 1981
3.414
+0.106
3.19%
jan 1, 1982
2.247
-1.167
-34.19%
jan 1, 1983
1.406
-0.841
-37.44%
jan 1, 1984
1.731
+0.325
23.15%
jan 1, 1985
1.694
-0.037
-2.14%
jan 1, 1986
1.973
+0.279
16.49%
jan 1, 1987
2.078
+0.105
5.34%
jan 1, 1988
1.726
-0.352
-16.94%
jan 1, 1989
2.204
+0.478
27.67%
jan 1, 1990
1.823
-0.381
-17.31%
jan 1, 1991
1.68
-0.143
-7.84%
jan 1, 1992
1.505
-0.174
-10.38%
jan 1, 1993
1.444
-0.062
-4.1%
jan 1, 1994
1.336
-0.107
-7.43%
jan 1, 1995
1.371
+0.035
2.6%
jan 1, 1996
1.111
-0.26
-18.99%
jan 1, 1997
1.044
-0.067
-6.0%
jan 1, 1998
0.922
-0.123
-11.74%
jan 1, 1999
0.93
+0.008
0.91%
jan 1, 2000
0.995
+0.065
6.95%
jan 1, 2001
0.865
-0.13
-13.03%
jan 1, 2002
0.897
+0.032
3.7%
jan 1, 2003
0.805
-0.092
-10.26%
jan 1, 2004
0.792
-0.013
-1.6%
jan 1, 2005
0.497
-0.295
-37.2%
jan 1, 2006
0.36
-0.138
-27.67%
jan 1, 2007
0.372
+0.012
3.44%
jan 1, 2008
0.341
-0.031
-8.36%
jan 1, 2009
0.303
-0.038
-11.17%
jan 1, 2010
0.236
-0.067
-21.97%
jan 1, 2011
0.213
-0.023
-9.82%
jan 1, 2012
0.181
-0.032
-15.1%
jan 1, 2013
0.246
+0.065
35.85%
jan 1, 2014
0.245
-0.001
-0.45%
Ranking of countries by current statistics by years


Comments: