29
/
en
AIzaSyAYiBZKx7MnpbEhh9jyipgxe19OcubqV5w
April 1, 2024
24735
Caribbean small states
CSS
false
2
1
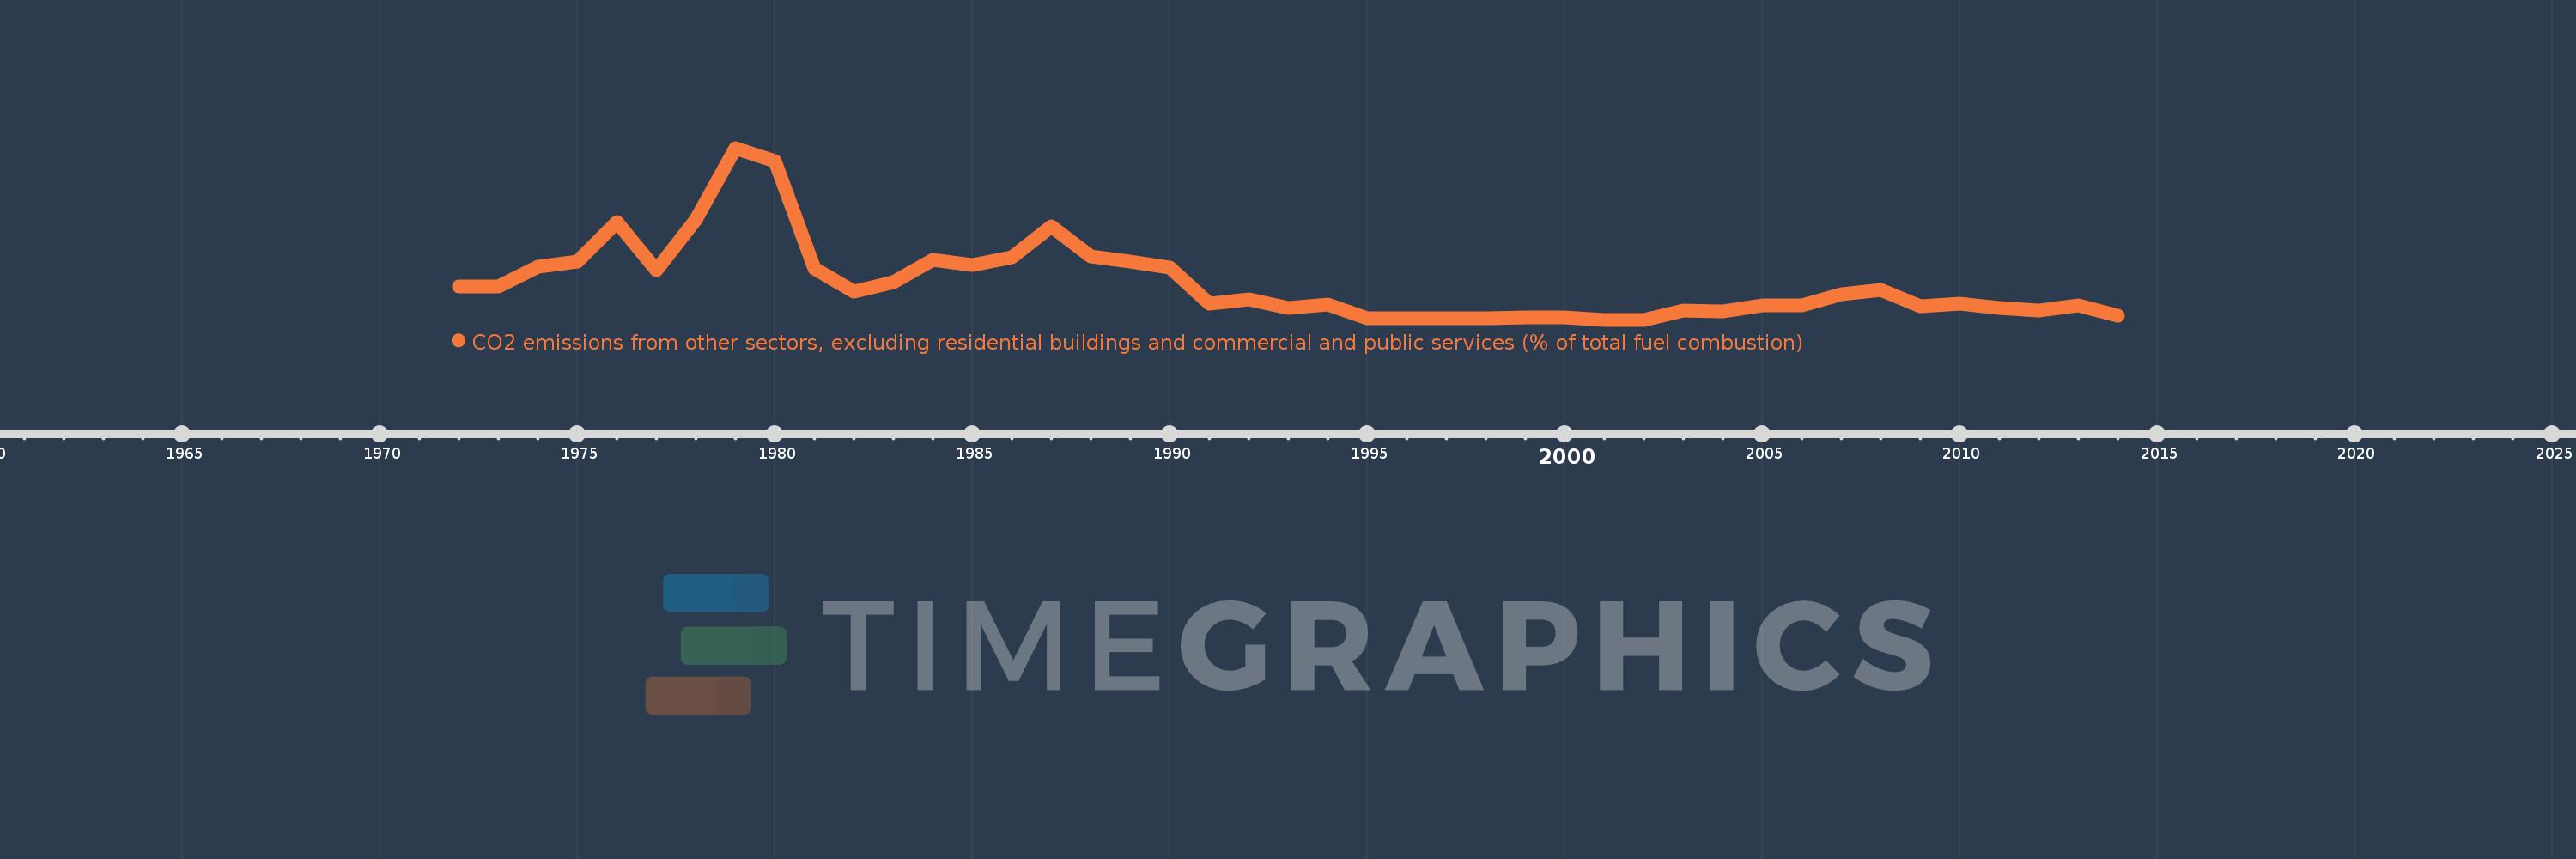
CO2 emissions from other sectors, excluding residential buildings and commercial and public services (% of total fuel combustion)
2014,2013,2012,2011,2010,2009,2008,2007,2006,2005,2004,2003,2002,2001,2000,1999,1998,1997,1996,1995,1994,1993,1992,1991,1990,1989,1988,1987,1986,1985,1984,1983,1982,1981,1980,1979,1978,1977,1976,1975,1974,1973,1972
This statistics in other country:
AlbaniaAlgeriaAngolaArab WorldArgentinaArmeniaAustraliaAustriaAzerbaijanBahrainBangladeshBelarusBelgiumBeninBoliviaBosnia and HerzegovinaBotswanaBrazilBrunei DarussalamBulgariaCambodiaCameroonCanadaCaribbean small statesCentral Europe and the BalticsChileChinaColombiaCongo, Dem. Rep.Congo, Rep.Costa RicaCote d'IvoireCroatiaCubaCuracaoCyprusCzech RepublicDenmarkDominican RepublicEarly-demographic dividendEast Asia & PacificEast Asia & Pacific (excluding high income)East Asia & Pacific (IDA & IBRD countries)EcuadorEgypt, Arab Rep.El SalvadorEritreaEstoniaEthiopiaEuro areaEurope & Central AsiaEurope & Central Asia (excluding high income)Europe & Central Asia (IDA & IBRD countries)European UnionFinlandFragile and conflict affected situationsFranceGabonGeorgiaGermanyGhanaGibraltarGreeceGuatemalaHaitiHeavily indebted poor countries (HIPC)High incomeHondurasHong Kong SAR, ChinaHungaryIBRD onlyIcelandIDA & IBRD totalIDA blendIDA onlyIDA totalIndiaIndonesiaIran, Islamic Rep.IraqIrelandIsraelItalyJamaicaJapanJordanKazakhstanKenyaKorea, Dem. People’s Rep.Korea, Rep.KosovoKuwaitKyrgyz RepublicLate-demographic dividendLatin America & Caribbean Latin America & Caribbean (excluding high income)Latin America & the Caribbean (IDA & IBRD countries)LatviaLeast developed countries: UN classificationLebanonLibyaLithuaniaLow & middle incomeLow incomeLower middle incomeLuxembourgMacedonia, FYRMalaysiaMaltaMauritiusMexicoMiddle East & North AfricaMiddle East & North Africa (excluding high income)Middle East & North Africa (IDA & IBRD countries)Middle incomeMoldovaMongoliaMontenegroMoroccoMozambiqueMyanmarNamibiaNepalNetherlandsNew ZealandNicaraguaNigerNigeriaNorth AmericaNorwayOECD membersOmanOther small statesPakistanPanamaParaguayPeruPhilippinesPolandPortugalPost-demographic dividendPre-demographic dividendQatarRomaniaRussian FederationSaudi ArabiaSenegalSerbiaSingaporeSlovak RepublicSloveniaSmall statesSouth AfricaSouth AsiaSouth Asia (IDA & IBRD)South SudanSpainSri LankaSub-Saharan Africa Sub-Saharan Africa (excluding high income)Sub-Saharan Africa (IDA & IBRD countries)SudanSwedenSwitzerlandSyrian Arab RepublicTajikistanTanzaniaThailandTogoTrinidad and TobagoTunisiaTurkeyTurkmenistanUkraineUnited Arab EmiratesUnited KingdomUnited StatesUpper middle incomeUruguayUzbekistanVenezuela, RBVietnamWorldYemen, Rep.ZambiaZimbabwe Timeline:
This timeline shows a graph from 1972 to 2014 of Caribbean small states. No data until 1971. Number of actual observations by date: 43.
Source name:
World Development Indicators
Source organization:
IEA Statistics © OECD/IEA 2014 (http://www.iea.org/stats/index.asp), subject to https://www.iea.org/t&c/termsandconditions/
Categories, topics:
Environment
Last updated:
apr 23, 2017
Indicators value changes by year
At the date of observation
Value
Absolute change
Change from previous value
jan 1, 1972
1.468
+1.468
0.0%
jan 1, 1973
1.472
+0.004
0.27%
jan 1, 1974
2.331
+0.859
58.35%
jan 1, 1975
2.54
+0.209
8.97%
jan 1, 1976
4.243
+1.703
67.07%
jan 1, 1977
2.197
-2.046
-48.22%
jan 1, 1978
4.382
+2.185
99.46%
jan 1, 1979
7.453
+3.072
70.1%
jan 1, 1980
6.889
-0.565
-7.58%
jan 1, 1981
2.246
-4.642
-67.39%
jan 1, 1982
1.239
-1.007
-44.84%
jan 1, 1983
1.668
+0.429
34.62%
jan 1, 1984
2.629
+0.961
57.64%
jan 1, 1985
2.423
-0.207
-7.86%
jan 1, 1986
2.739
+0.316
13.03%
jan 1, 1987
4.089
+1.35
49.31%
jan 1, 1988
2.78
-1.309
-32.01%
jan 1, 1989
2.542
-0.238
-8.58%
jan 1, 1990
2.304
-0.238
-9.36%
jan 1, 1991
0.727
-1.577
-68.46%
jan 1, 1992
0.932
+0.206
28.29%
jan 1, 1993
0.56
-0.372
-39.95%
jan 1, 1994
0.689
+0.129
23.06%
jan 1, 1995
0.123
-0.565
-82.1%
jan 1, 1996
0.121
-0.003
-2.17%
jan 1, 1997
0.116
-0.005
-3.94%
jan 1, 1998
0.111
-0.005
-4.48%
jan 1, 1999
0.158
+0.048
43.11%
jan 1, 2000
0.156
-0.002
-1.46%
jan 1, 2001
0.05
-0.106
-67.79%
jan 1, 2002
0.046
-0.004
-7.87%
jan 1, 2003
0.434
+0.388
837.47%
jan 1, 2004
0.391
-0.043
-10.0%
jan 1, 2005
0.654
+0.263
67.32%
jan 1, 2006
0.647
-0.007
-1.04%
jan 1, 2007
1.155
+0.508
78.45%
jan 1, 2008
1.347
+0.193
16.69%
jan 1, 2009
0.64
-0.707
-52.48%
jan 1, 2010
0.723
+0.083
12.9%
jan 1, 2011
0.547
-0.176
-24.37%
jan 1, 2012
0.44
-0.107
-19.52%
jan 1, 2013
0.654
+0.214
48.67%
jan 1, 2014
0.23
-0.424
-64.79%
Ranking of countries by current statistics by years


Comments: