29
/
en
AIzaSyAYiBZKx7MnpbEhh9jyipgxe19OcubqV5w
April 1, 2024
224641
Poland
POL
true
2
1
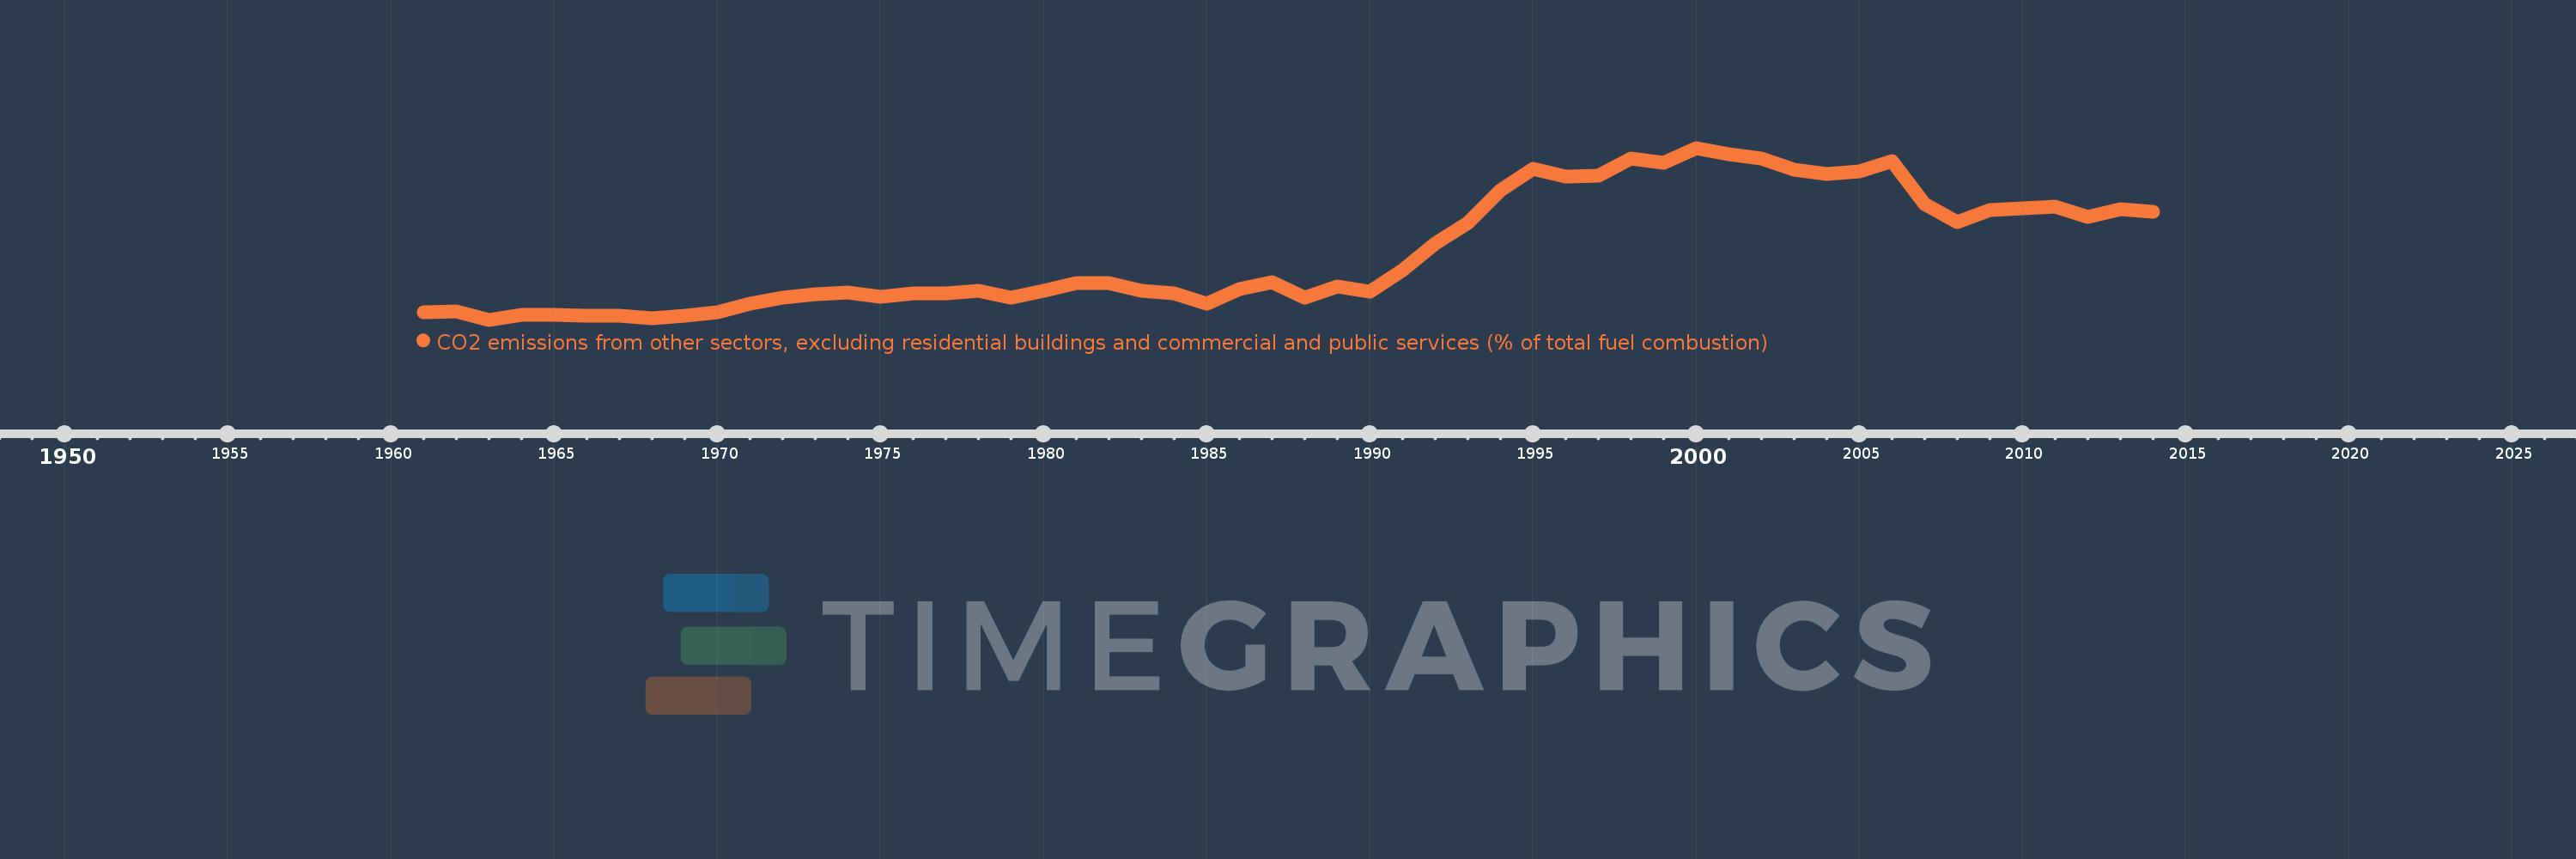
CO2 emissions from other sectors, excluding residential buildings and commercial and public services (% of total fuel combustion)
2014,2013,2012,2011,2010,2009,2008,2007,2006,2005,2004,2003,2002,2001,2000,1999,1998,1997,1996,1995,1994,1993,1992,1991,1990,1989,1988,1987,1986,1985,1984,1983,1982,1981,1980,1979,1978,1977,1976,1975,1974,1973,1972,1971,1970,1969,1968,1967,1966,1965,1964,1963,1962,1961
Global statistics library →Poland →CO2 emissions from other sectors, excluding residential buildings and commercial and public services (% of total fuel combustion)
This statistics in other country:
AlbaniaAlgeriaAngolaArab WorldArgentinaArmeniaAustraliaAustriaAzerbaijanBahrainBangladeshBelarusBelgiumBeninBoliviaBosnia and HerzegovinaBotswanaBrazilBrunei DarussalamBulgariaCambodiaCameroonCanadaCaribbean small statesCentral Europe and the BalticsChileChinaColombiaCongo, Dem. Rep.Congo, Rep.Costa RicaCote d'IvoireCroatiaCubaCuracaoCyprusCzech RepublicDenmarkDominican RepublicEarly-demographic dividendEast Asia & PacificEast Asia & Pacific (excluding high income)East Asia & Pacific (IDA & IBRD countries)EcuadorEgypt, Arab Rep.El SalvadorEritreaEstoniaEthiopiaEuro areaEurope & Central AsiaEurope & Central Asia (excluding high income)Europe & Central Asia (IDA & IBRD countries)European UnionFinlandFragile and conflict affected situationsFranceGabonGeorgiaGermanyGhanaGibraltarGreeceGuatemalaHaitiHeavily indebted poor countries (HIPC)High incomeHondurasHong Kong SAR, ChinaHungaryIBRD onlyIcelandIDA & IBRD totalIDA blendIDA onlyIDA totalIndiaIndonesiaIran, Islamic Rep.IraqIrelandIsraelItalyJamaicaJapanJordanKazakhstanKenyaKorea, Dem. People’s Rep.Korea, Rep.KosovoKuwaitKyrgyz RepublicLate-demographic dividendLatin America & Caribbean Latin America & Caribbean (excluding high income)Latin America & the Caribbean (IDA & IBRD countries)LatviaLeast developed countries: UN classificationLebanonLibyaLithuaniaLow & middle incomeLow incomeLower middle incomeLuxembourgMacedonia, FYRMalaysiaMaltaMauritiusMexicoMiddle East & North AfricaMiddle East & North Africa (excluding high income)Middle East & North Africa (IDA & IBRD countries)Middle incomeMoldovaMongoliaMontenegroMoroccoMozambiqueMyanmarNamibiaNepalNetherlandsNew ZealandNicaraguaNigerNigeriaNorth AmericaNorwayOECD membersOmanOther small statesPakistanPanamaParaguayPeruPhilippinesPolandPortugalPost-demographic dividendPre-demographic dividendQatarRomaniaRussian FederationSaudi ArabiaSenegalSerbiaSingaporeSlovak RepublicSloveniaSmall statesSouth AfricaSouth AsiaSouth Asia (IDA & IBRD)South SudanSpainSri LankaSub-Saharan Africa Sub-Saharan Africa (excluding high income)Sub-Saharan Africa (IDA & IBRD countries)SudanSwedenSwitzerlandSyrian Arab RepublicTajikistanTanzaniaThailandTogoTrinidad and TobagoTunisiaTurkeyTurkmenistanUkraineUnited Arab EmiratesUnited KingdomUnited StatesUpper middle incomeUruguayUzbekistanVenezuela, RBVietnamWorldYemen, Rep.ZambiaZimbabwe Timeline:
This timeline shows a graph from 1961 to 2014 of Poland. No data until 1960. Number of actual observations by date: 54.
Source name:
World Development Indicators
Source organization:
IEA Statistics © OECD/IEA 2014 (http://www.iea.org/stats/index.asp), subject to https://www.iea.org/t&c/termsandconditions/
Categories, topics:
Environment
Last updated:
apr 23, 2017
Indicators value changes by year
At the date of observation
Value
Absolute change
Change from previous value
jan 1, 1961
1.598
+1.598
0.0%
jan 1, 1962
1.617
+0.019
1.2%
jan 1, 1963
1.464
-0.153
-9.49%
jan 1, 1964
1.556
+0.092
6.27%
jan 1, 1965
1.552
-0.004
-0.23%
jan 1, 1966
1.538
-0.014
-0.92%
jan 1, 1967
1.535
-0.003
-0.16%
jan 1, 1968
1.484
-0.051
-3.32%
jan 1, 1969
1.534
+0.05
3.34%
jan 1, 1970
1.6
+0.067
4.34%
jan 1, 1971
1.745
+0.145
9.06%
jan 1, 1972
1.858
+0.113
6.47%
jan 1, 1973
1.913
+0.054
2.93%
jan 1, 1974
1.947
+0.034
1.79%
jan 1, 1975
1.86
-0.087
-4.45%
jan 1, 1976
1.927
+0.067
3.58%
jan 1, 1977
1.934
+0.007
0.37%
jan 1, 1978
1.976
+0.042
2.16%
jan 1, 1979
1.857
-0.119
-6.02%
jan 1, 1980
1.967
+0.111
5.96%
jan 1, 1981
2.111
+0.143
7.28%
jan 1, 1982
2.112
+0.002
0.09%
jan 1, 1983
1.975
-0.137
-6.49%
jan 1, 1984
1.928
-0.047
-2.38%
jan 1, 1985
1.752
-0.176
-9.12%
jan 1, 1986
2.007
+0.255
14.56%
jan 1, 1987
2.118
+0.111
5.51%
jan 1, 1988
1.848
-0.27
-12.75%
jan 1, 1989
2.05
+0.202
10.91%
jan 1, 1990
1.954
-0.096
-4.68%
jan 1, 1991
2.326
+0.372
19.04%
jan 1, 1992
2.807
+0.481
20.69%
jan 1, 1993
3.167
+0.36
12.81%
jan 1, 1994
3.738
+0.571
18.05%
jan 1, 1995
4.118
+0.38
10.16%
jan 1, 1996
3.977
-0.141
-3.42%
jan 1, 1997
3.995
+0.018
0.45%
jan 1, 1998
4.299
+0.304
7.62%
jan 1, 1999
4.216
-0.083
-1.94%
jan 1, 2000
4.477
+0.261
6.2%
jan 1, 2001
4.36
-0.117
-2.61%
jan 1, 2002
4.298
-0.062
-1.42%
jan 1, 2003
4.1
-0.198
-4.61%
jan 1, 2004
4.021
-0.079
-1.93%
jan 1, 2005
4.07
+0.049
1.23%
jan 1, 2006
4.252
+0.182
4.47%
jan 1, 2007
3.495
-0.758
-17.82%
jan 1, 2008
3.184
-0.311
-8.9%
jan 1, 2009
3.386
+0.202
6.33%
jan 1, 2010
3.425
+0.039
1.16%
jan 1, 2011
3.454
+0.029
0.84%
jan 1, 2012
3.266
-0.188
-5.44%
jan 1, 2013
3.406
+0.14
4.3%
jan 1, 2014
3.365
-0.041
-1.21%
Ranking of countries by current statistics by years


Comments: