29
/
en
AIzaSyAYiBZKx7MnpbEhh9jyipgxe19OcubqV5w
April 1, 2024
93328
Bulgaria
BGR
true
2
1
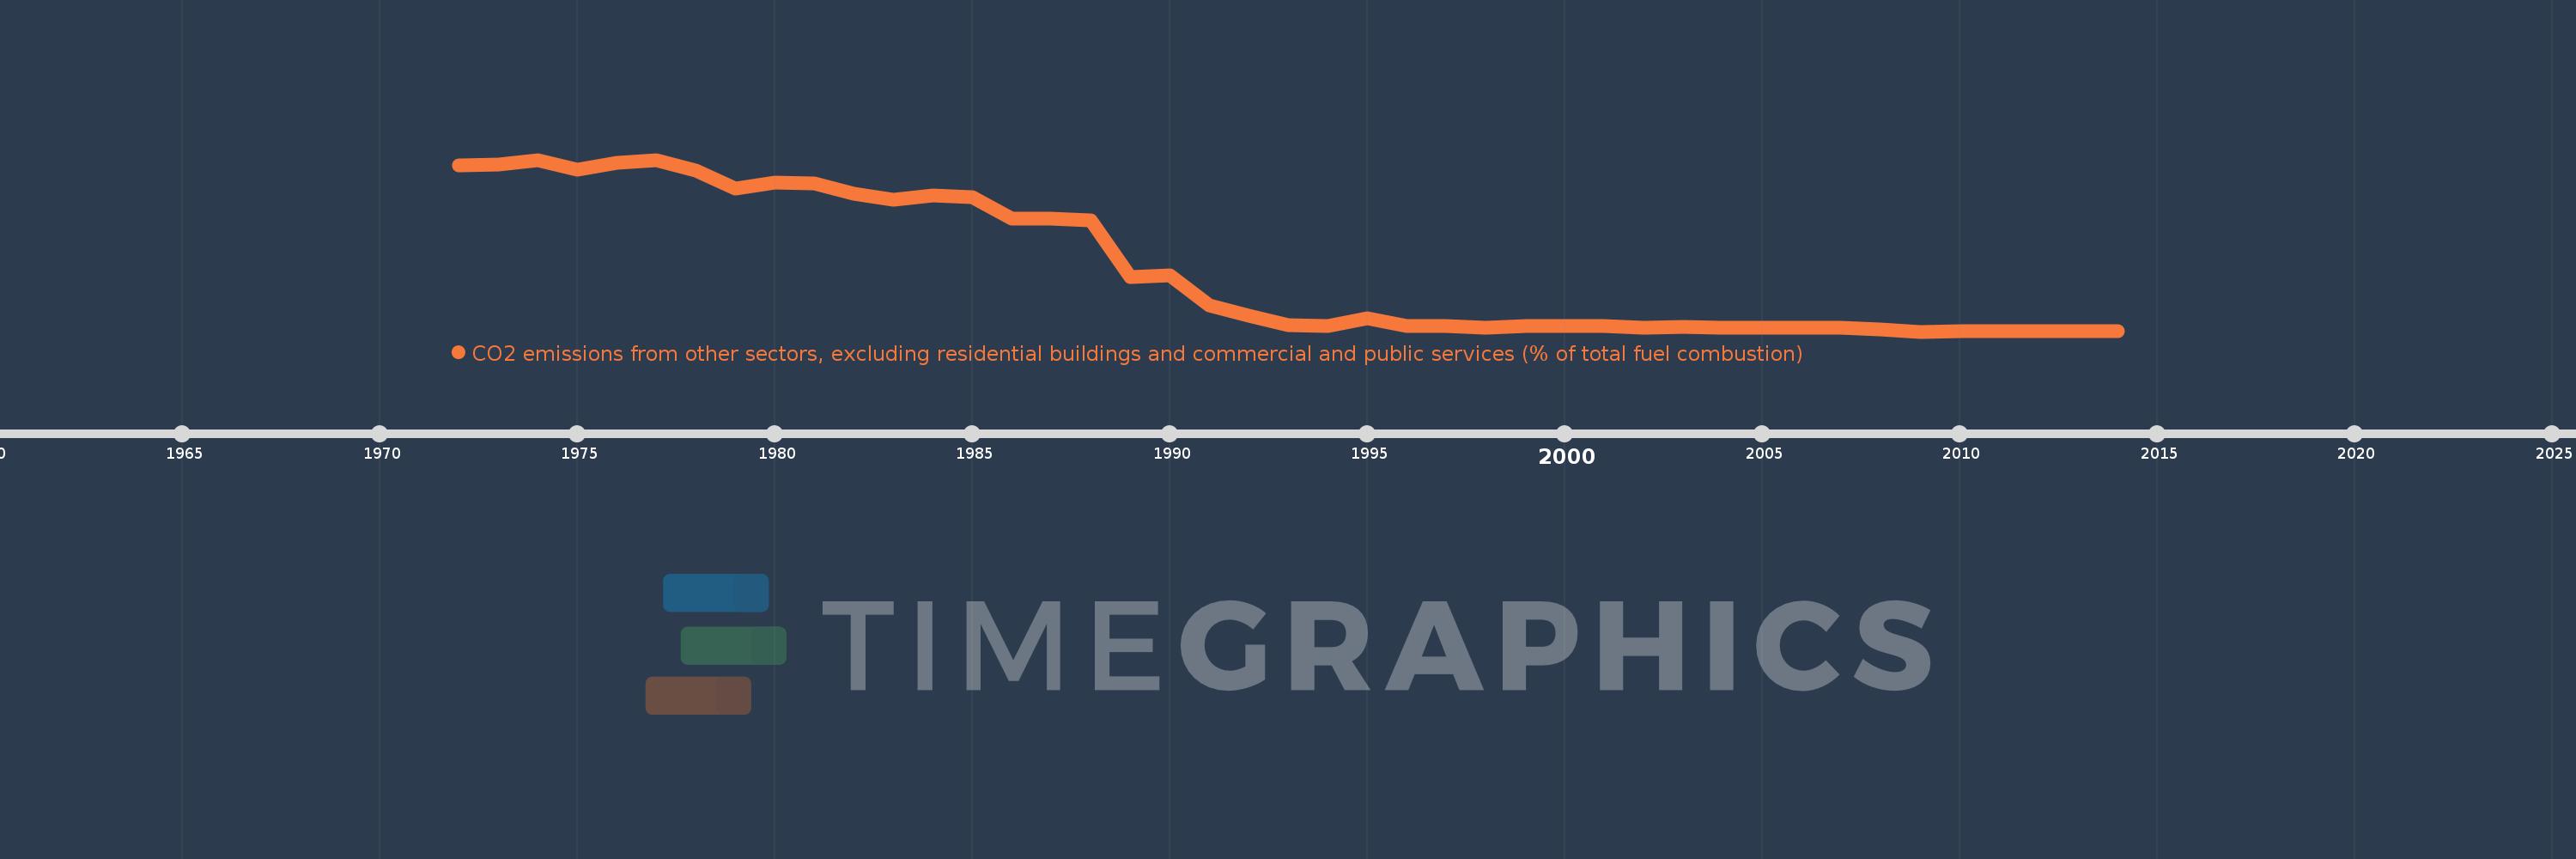
CO2 emissions from other sectors, excluding residential buildings and commercial and public services (% of total fuel combustion)
2014,2013,2012,2011,2010,2009,2008,2007,2006,2005,2004,2003,2002,2001,2000,1999,1998,1997,1996,1995,1994,1993,1992,1991,1990,1989,1988,1987,1986,1985,1984,1983,1982,1981,1980,1979,1978,1977,1976,1975,1974,1973,1972
Global statistics library →Bulgaria →CO2 emissions from other sectors, excluding residential buildings and commercial and public services (% of total fuel combustion)
This statistics in other country:
AlbaniaAlgeriaAngolaArab WorldArgentinaArmeniaAustraliaAustriaAzerbaijanBahrainBangladeshBelarusBelgiumBeninBoliviaBosnia and HerzegovinaBotswanaBrazilBrunei DarussalamBulgariaCambodiaCameroonCanadaCaribbean small statesCentral Europe and the BalticsChileChinaColombiaCongo, Dem. Rep.Congo, Rep.Costa RicaCote d'IvoireCroatiaCubaCuracaoCyprusCzech RepublicDenmarkDominican RepublicEarly-demographic dividendEast Asia & PacificEast Asia & Pacific (excluding high income)East Asia & Pacific (IDA & IBRD countries)EcuadorEgypt, Arab Rep.El SalvadorEritreaEstoniaEthiopiaEuro areaEurope & Central AsiaEurope & Central Asia (excluding high income)Europe & Central Asia (IDA & IBRD countries)European UnionFinlandFragile and conflict affected situationsFranceGabonGeorgiaGermanyGhanaGibraltarGreeceGuatemalaHaitiHeavily indebted poor countries (HIPC)High incomeHondurasHong Kong SAR, ChinaHungaryIBRD onlyIcelandIDA & IBRD totalIDA blendIDA onlyIDA totalIndiaIndonesiaIran, Islamic Rep.IraqIrelandIsraelItalyJamaicaJapanJordanKazakhstanKenyaKorea, Dem. People’s Rep.Korea, Rep.KosovoKuwaitKyrgyz RepublicLate-demographic dividendLatin America & Caribbean Latin America & Caribbean (excluding high income)Latin America & the Caribbean (IDA & IBRD countries)LatviaLeast developed countries: UN classificationLebanonLibyaLithuaniaLow & middle incomeLow incomeLower middle incomeLuxembourgMacedonia, FYRMalaysiaMaltaMauritiusMexicoMiddle East & North AfricaMiddle East & North Africa (excluding high income)Middle East & North Africa (IDA & IBRD countries)Middle incomeMoldovaMongoliaMontenegroMoroccoMozambiqueMyanmarNamibiaNepalNetherlandsNew ZealandNicaraguaNigerNigeriaNorth AmericaNorwayOECD membersOmanOther small statesPakistanPanamaParaguayPeruPhilippinesPolandPortugalPost-demographic dividendPre-demographic dividendQatarRomaniaRussian FederationSaudi ArabiaSenegalSerbiaSingaporeSlovak RepublicSloveniaSmall statesSouth AfricaSouth AsiaSouth Asia (IDA & IBRD)South SudanSpainSri LankaSub-Saharan Africa Sub-Saharan Africa (excluding high income)Sub-Saharan Africa (IDA & IBRD countries)SudanSwedenSwitzerlandSyrian Arab RepublicTajikistanTanzaniaThailandTogoTrinidad and TobagoTunisiaTurkeyTurkmenistanUkraineUnited Arab EmiratesUnited KingdomUnited StatesUpper middle incomeUruguayUzbekistanVenezuela, RBVietnamWorldYemen, Rep.ZambiaZimbabwe Timeline:
This timeline shows a graph from 1972 to 2014 of Bulgaria. No data until 1971. Number of actual observations by date: 43.
Source name:
World Development Indicators
Source organization:
IEA Statistics © OECD/IEA 2014 (http://www.iea.org/stats/index.asp), subject to https://www.iea.org/t&c/termsandconditions/
Categories, topics:
Environment
Last updated:
apr 23, 2017
Indicators value changes by year
Maximum:
35.518
jan 1, 1974
At the date of observation
Value
Absolute change
Change from previous value
jan 1, 1972
34.461
+34.461
0.0%
jan 1, 1973
34.593
+0.132
0.38%
jan 1, 1974
35.518
+0.925
2.67%
jan 1, 1975
33.45
-2.069
-5.82%
jan 1, 1976
34.847
+1.398
4.18%
jan 1, 1977
35.437
+0.59
1.69%
jan 1, 1978
33.333
-2.104
-5.94%
jan 1, 1979
29.66
-3.674
-11.02%
jan 1, 1980
30.878
+1.218
4.11%
jan 1, 1981
30.77
-0.108
-0.35%
jan 1, 1982
28.617
-2.153
-7.0%
jan 1, 1983
27.478
-1.139
-3.98%
jan 1, 1984
28.364
+0.886
3.22%
jan 1, 1985
28.086
-0.278
-0.98%
jan 1, 1986
23.69
-4.396
-15.65%
jan 1, 1987
23.729
+0.039
0.17%
jan 1, 1988
23.347
-0.382
-1.61%
jan 1, 1989
11.962
-11.385
-48.76%
jan 1, 1990
12.231
+0.269
2.25%
jan 1, 1991
6.303
-5.928
-48.47%
jan 1, 1992
4.222
-2.081
-33.02%
jan 1, 1993
2.236
-1.986
-47.03%
jan 1, 1994
2.073
-0.163
-7.3%
jan 1, 1995
3.59
+1.517
73.17%
jan 1, 1996
2.143
-1.447
-40.32%
jan 1, 1997
2.031
-0.112
-5.22%
jan 1, 1998
1.852
-0.179
-8.81%
jan 1, 1999
2.101
+0.249
13.46%
jan 1, 2000
2.114
+0.013
0.62%
jan 1, 2001
2.086
-0.029
-1.35%
jan 1, 2002
1.799
-0.287
-13.76%
jan 1, 2003
1.906
+0.108
5.98%
jan 1, 2004
1.733
-0.173
-9.07%
jan 1, 2005
1.703
-0.03
-1.75%
jan 1, 2006
1.828
+0.125
7.33%
jan 1, 2007
1.784
-0.044
-2.41%
jan 1, 2008
1.471
-0.313
-17.54%
jan 1, 2009
0.989
-0.482
-32.76%
jan 1, 2010
1.132
+0.143
14.46%
jan 1, 2011
1.036
-0.096
-8.48%
jan 1, 2012
1.036
+0.0
0.03%
jan 1, 2013
1.125
+0.088
8.54%
jan 1, 2014
1.144
+0.02
1.74%
Ranking of countries by current statistics by years


Comments: