29
/
en
AIzaSyAYiBZKx7MnpbEhh9jyipgxe19OcubqV5w
April 1, 2024
153364
Iceland
ISL
true
2
1
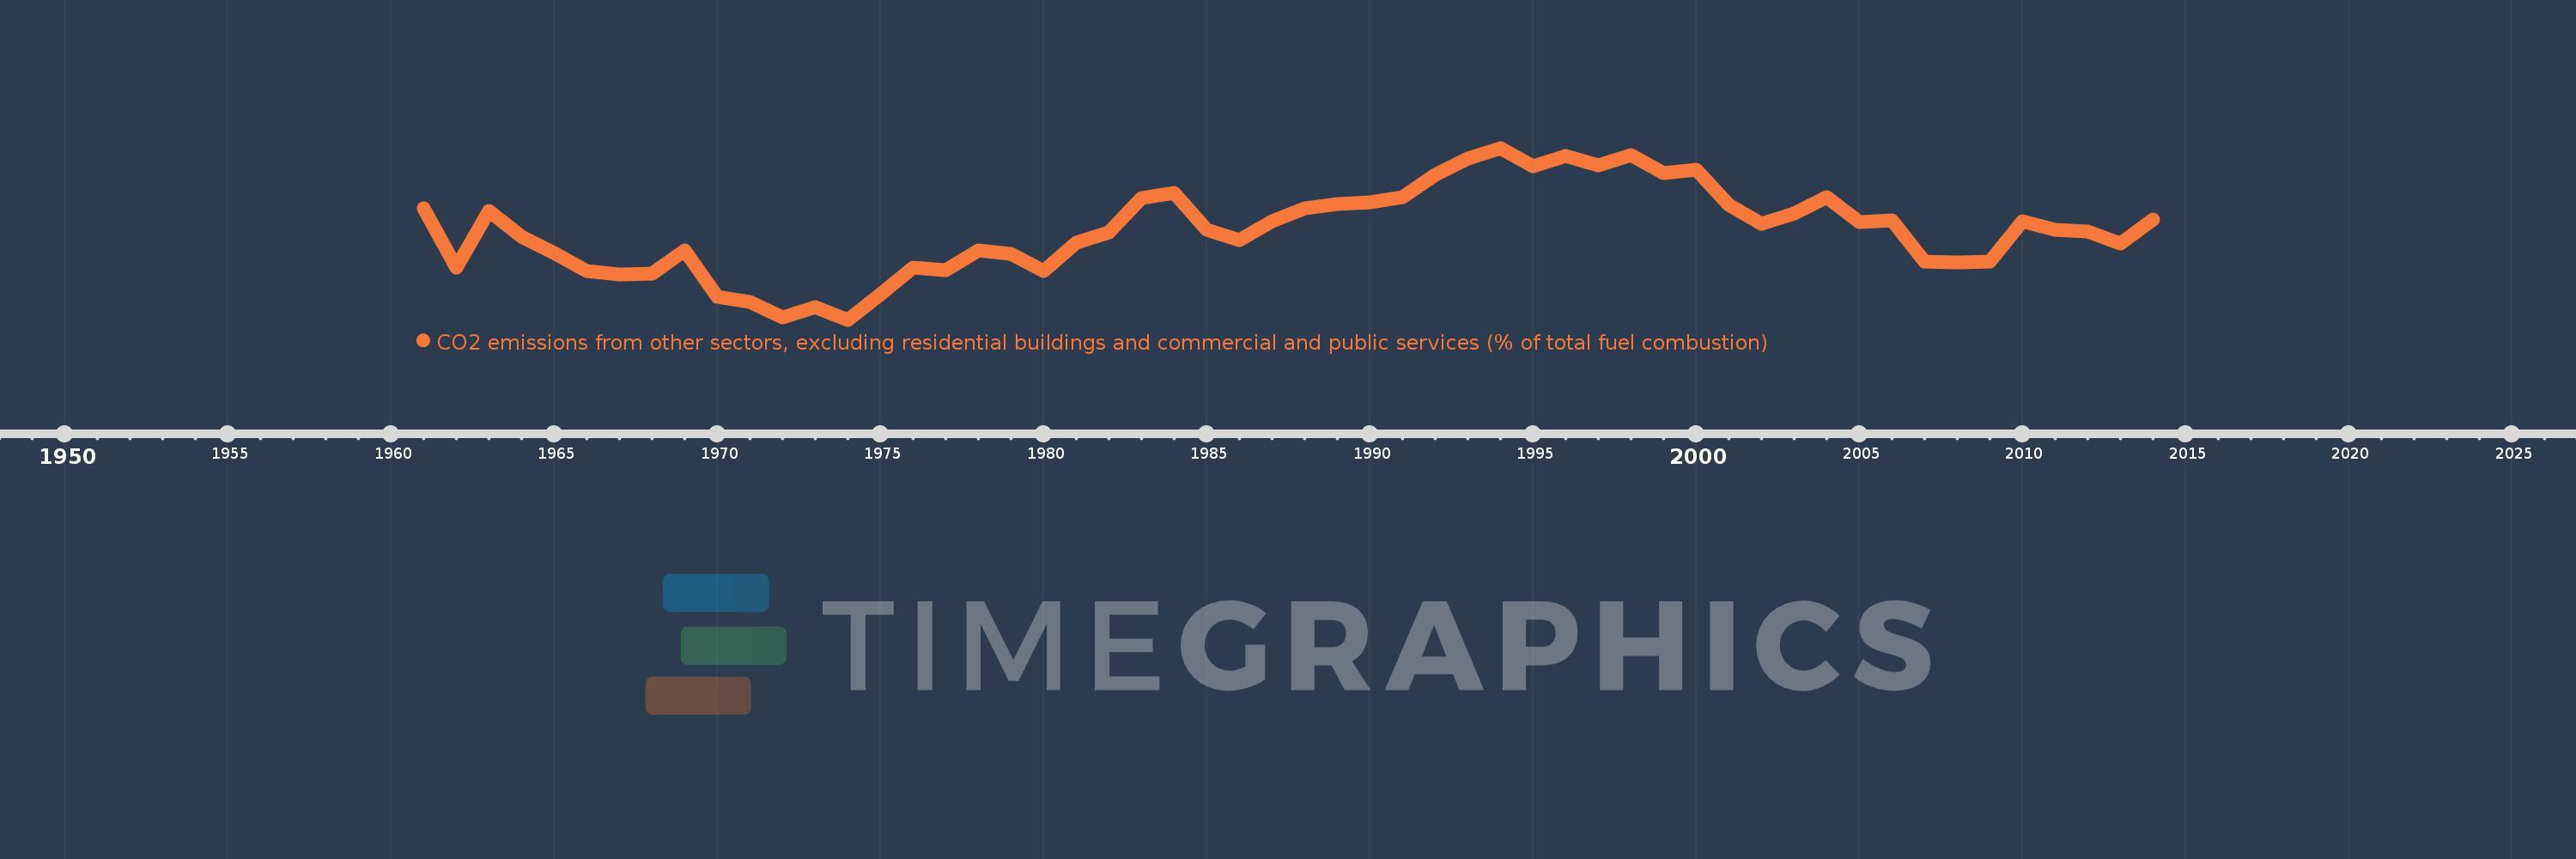
CO2 emissions from other sectors, excluding residential buildings and commercial and public services (% of total fuel combustion)
2014,2013,2012,2011,2010,2009,2008,2007,2006,2005,2004,2003,2002,2001,2000,1999,1998,1997,1996,1995,1994,1993,1992,1991,1990,1989,1988,1987,1986,1985,1984,1983,1982,1981,1980,1979,1978,1977,1976,1975,1974,1973,1972,1971,1970,1969,1968,1967,1966,1965,1964,1963,1962,1961
Global statistics library →Iceland →CO2 emissions from other sectors, excluding residential buildings and commercial and public services (% of total fuel combustion)
This statistics in other country:
AlbaniaAlgeriaAngolaArab WorldArgentinaArmeniaAustraliaAustriaAzerbaijanBahrainBangladeshBelarusBelgiumBeninBoliviaBosnia and HerzegovinaBotswanaBrazilBrunei DarussalamBulgariaCambodiaCameroonCanadaCaribbean small statesCentral Europe and the BalticsChileChinaColombiaCongo, Dem. Rep.Congo, Rep.Costa RicaCote d'IvoireCroatiaCubaCuracaoCyprusCzech RepublicDenmarkDominican RepublicEarly-demographic dividendEast Asia & PacificEast Asia & Pacific (excluding high income)East Asia & Pacific (IDA & IBRD countries)EcuadorEgypt, Arab Rep.El SalvadorEritreaEstoniaEthiopiaEuro areaEurope & Central AsiaEurope & Central Asia (excluding high income)Europe & Central Asia (IDA & IBRD countries)European UnionFinlandFragile and conflict affected situationsFranceGabonGeorgiaGermanyGhanaGibraltarGreeceGuatemalaHaitiHeavily indebted poor countries (HIPC)High incomeHondurasHong Kong SAR, ChinaHungaryIBRD onlyIcelandIDA & IBRD totalIDA blendIDA onlyIDA totalIndiaIndonesiaIran, Islamic Rep.IraqIrelandIsraelItalyJamaicaJapanJordanKazakhstanKenyaKorea, Dem. People’s Rep.Korea, Rep.KosovoKuwaitKyrgyz RepublicLate-demographic dividendLatin America & Caribbean Latin America & Caribbean (excluding high income)Latin America & the Caribbean (IDA & IBRD countries)LatviaLeast developed countries: UN classificationLebanonLibyaLithuaniaLow & middle incomeLow incomeLower middle incomeLuxembourgMacedonia, FYRMalaysiaMaltaMauritiusMexicoMiddle East & North AfricaMiddle East & North Africa (excluding high income)Middle East & North Africa (IDA & IBRD countries)Middle incomeMoldovaMongoliaMontenegroMoroccoMozambiqueMyanmarNamibiaNepalNetherlandsNew ZealandNicaraguaNigerNigeriaNorth AmericaNorwayOECD membersOmanOther small statesPakistanPanamaParaguayPeruPhilippinesPolandPortugalPost-demographic dividendPre-demographic dividendQatarRomaniaRussian FederationSaudi ArabiaSenegalSerbiaSingaporeSlovak RepublicSloveniaSmall statesSouth AfricaSouth AsiaSouth Asia (IDA & IBRD)South SudanSpainSri LankaSub-Saharan Africa Sub-Saharan Africa (excluding high income)Sub-Saharan Africa (IDA & IBRD countries)SudanSwedenSwitzerlandSyrian Arab RepublicTajikistanTanzaniaThailandTogoTrinidad and TobagoTunisiaTurkeyTurkmenistanUkraineUnited Arab EmiratesUnited KingdomUnited StatesUpper middle incomeUruguayUzbekistanVenezuela, RBVietnamWorldYemen, Rep.ZambiaZimbabwe Timeline:
This timeline shows a graph from 1961 to 2014 of Iceland. No data until 1960. Number of actual observations by date: 54.
Source name:
World Development Indicators
Source organization:
IEA Statistics © OECD/IEA 2014 (http://www.iea.org/stats/index.asp), subject to https://www.iea.org/t&c/termsandconditions/
Categories, topics:
Environment
Last updated:
apr 23, 2017
Indicators value changes by year
Maximum:
40.722
jan 1, 1994
At the date of observation
Value
Absolute change
Change from previous value
jan 1, 1961
33.333
+33.333
0.0%
jan 1, 1962
26.087
-7.246
-21.74%
jan 1, 1963
33.065
+6.978
26.75%
jan 1, 1964
29.921
-3.143
-9.51%
jan 1, 1965
27.907
-2.014
-6.73%
jan 1, 1966
25.714
-2.193
-7.86%
jan 1, 1967
25.333
-0.381
-1.48%
jan 1, 1968
25.352
+0.019
0.07%
jan 1, 1969
28.188
+2.836
11.19%
jan 1, 1970
22.556
-5.632
-19.98%
jan 1, 1971
21.97
-0.587
-2.6%
jan 1, 1972
20.0
-1.97
-8.97%
jan 1, 1973
21.333
+1.333
6.67%
jan 1, 1974
19.76
-1.573
-7.37%
jan 1, 1975
22.892
+3.131
15.85%
jan 1, 1976
26.087
+3.195
13.96%
jan 1, 1977
25.786
-0.301
-1.15%
jan 1, 1978
28.221
+2.435
9.44%
jan 1, 1979
27.841
-0.38
-1.35%
jan 1, 1980
25.683
-2.158
-7.75%
jan 1, 1981
29.143
+3.46
13.47%
jan 1, 1982
30.46
+1.317
4.52%
jan 1, 1983
34.615
+4.156
13.64%
jan 1, 1984
35.22
+0.605
1.75%
jan 1, 1985
30.769
-4.451
-12.64%
jan 1, 1986
29.448
-1.321
-4.29%
jan 1, 1987
31.765
+2.317
7.87%
jan 1, 1988
33.333
+1.569
4.94%
jan 1, 1989
33.88
+0.546
1.64%
jan 1, 1990
34.066
+0.186
0.55%
jan 1, 1991
34.737
+0.671
1.97%
jan 1, 1992
37.433
+2.696
7.76%
jan 1, 1993
39.474
+2.041
5.45%
jan 1, 1994
40.722
+1.248
3.16%
jan 1, 1995
38.537
-2.185
-5.37%
jan 1, 1996
39.796
+1.259
3.27%
jan 1, 1997
38.565
-1.231
-3.09%
jan 1, 1998
39.81
+1.245
3.23%
jan 1, 1999
37.619
-2.191
-5.5%
jan 1, 2000
38.049
+0.43
1.14%
jan 1, 2001
33.796
-4.252
-11.18%
jan 1, 2002
31.429
-2.368
-7.01%
jan 1, 2003
32.727
+1.299
4.13%
jan 1, 2004
34.703
+1.976
6.04%
jan 1, 2005
31.718
-2.985
-8.6%
jan 1, 2006
31.839
+0.121
0.38%
jan 1, 2007
26.872
-4.966
-15.6%
jan 1, 2008
26.724
-0.148
-0.55%
jan 1, 2009
26.887
+0.163
0.61%
jan 1, 2010
31.731
+4.844
18.02%
jan 1, 2011
30.769
-0.962
-3.03%
jan 1, 2012
30.481
-0.288
-0.94%
jan 1, 2013
29.032
-1.449
-4.75%
jan 1, 2014
32.02
+2.987
10.29%
Ranking of countries by current statistics by years


Comments: