29
/
en
AIzaSyAYiBZKx7MnpbEhh9jyipgxe19OcubqV5w
April 1, 2024
67533
Angola
AGO
true
2
1
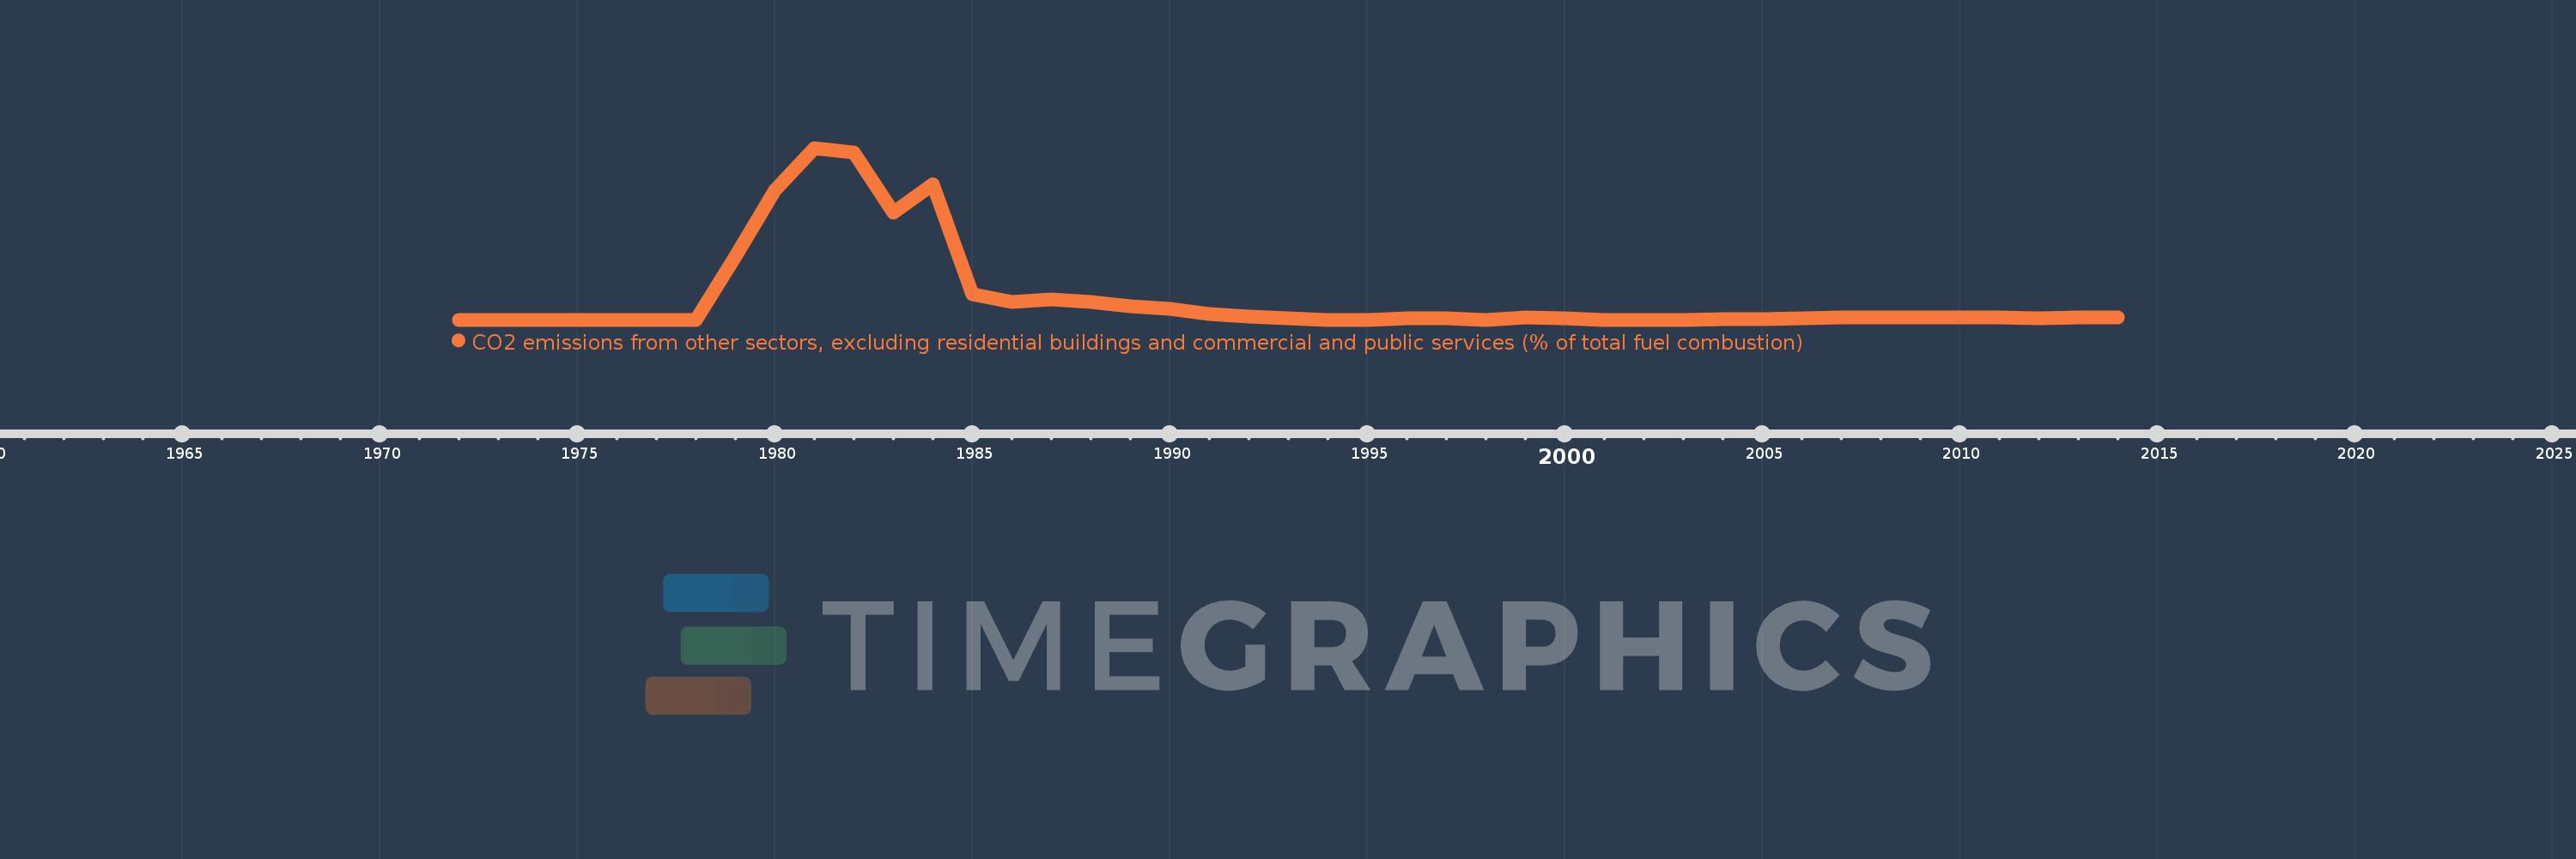
CO2 emissions from other sectors, excluding residential buildings and commercial and public services (% of total fuel combustion)
2014,2013,2012,2011,2010,2009,2008,2007,2006,2005,2004,2003,2002,2001,2000,1999,1998,1997,1996,1995,1994,1993,1992,1991,1990,1989,1988,1987,1986,1985,1984,1983,1982,1981,1980,1979,1978,1977,1976,1975,1974,1973,1972
Global statistics library →Angola →CO2 emissions from other sectors, excluding residential buildings and commercial and public services (% of total fuel combustion)
This statistics in other country:
AlbaniaAlgeriaAngolaArab WorldArgentinaArmeniaAustraliaAustriaAzerbaijanBahrainBangladeshBelarusBelgiumBeninBoliviaBosnia and HerzegovinaBotswanaBrazilBrunei DarussalamBulgariaCambodiaCameroonCanadaCaribbean small statesCentral Europe and the BalticsChileChinaColombiaCongo, Dem. Rep.Congo, Rep.Costa RicaCote d'IvoireCroatiaCubaCuracaoCyprusCzech RepublicDenmarkDominican RepublicEarly-demographic dividendEast Asia & PacificEast Asia & Pacific (excluding high income)East Asia & Pacific (IDA & IBRD countries)EcuadorEgypt, Arab Rep.El SalvadorEritreaEstoniaEthiopiaEuro areaEurope & Central AsiaEurope & Central Asia (excluding high income)Europe & Central Asia (IDA & IBRD countries)European UnionFinlandFragile and conflict affected situationsFranceGabonGeorgiaGermanyGhanaGibraltarGreeceGuatemalaHaitiHeavily indebted poor countries (HIPC)High incomeHondurasHong Kong SAR, ChinaHungaryIBRD onlyIcelandIDA & IBRD totalIDA blendIDA onlyIDA totalIndiaIndonesiaIran, Islamic Rep.IraqIrelandIsraelItalyJamaicaJapanJordanKazakhstanKenyaKorea, Dem. People’s Rep.Korea, Rep.KosovoKuwaitKyrgyz RepublicLate-demographic dividendLatin America & Caribbean Latin America & Caribbean (excluding high income)Latin America & the Caribbean (IDA & IBRD countries)LatviaLeast developed countries: UN classificationLebanonLibyaLithuaniaLow & middle incomeLow incomeLower middle incomeLuxembourgMacedonia, FYRMalaysiaMaltaMauritiusMexicoMiddle East & North AfricaMiddle East & North Africa (excluding high income)Middle East & North Africa (IDA & IBRD countries)Middle incomeMoldovaMongoliaMontenegroMoroccoMozambiqueMyanmarNamibiaNepalNetherlandsNew ZealandNicaraguaNigerNigeriaNorth AmericaNorwayOECD membersOmanOther small statesPakistanPanamaParaguayPeruPhilippinesPolandPortugalPost-demographic dividendPre-demographic dividendQatarRomaniaRussian FederationSaudi ArabiaSenegalSerbiaSingaporeSlovak RepublicSloveniaSmall statesSouth AfricaSouth AsiaSouth Asia (IDA & IBRD)South SudanSpainSri LankaSub-Saharan Africa Sub-Saharan Africa (excluding high income)Sub-Saharan Africa (IDA & IBRD countries)SudanSwedenSwitzerlandSyrian Arab RepublicTajikistanTanzaniaThailandTogoTrinidad and TobagoTunisiaTurkeyTurkmenistanUkraineUnited Arab EmiratesUnited KingdomUnited StatesUpper middle incomeUruguayUzbekistanVenezuela, RBVietnamWorldYemen, Rep.ZambiaZimbabwe Timeline:
This timeline shows a graph from 1972 to 2014 of Angola. No data until 1971. Number of actual observations by date: 43.
Source name:
World Development Indicators
Source organization:
IEA Statistics © OECD/IEA 2014 (http://www.iea.org/stats/index.asp), subject to https://www.iea.org/t&c/termsandconditions/
Categories, topics:
Environment
Last updated:
apr 23, 2017
Indicators value changes by year
At the date of observation
Value
Absolute change
Change from previous value
jan 1, 1979
8.915
+8.915
%
jan 1, 1980
18.11
+9.196
103.15%
jan 1, 1981
24.06
+5.95
32.85%
jan 1, 1982
23.413
-0.647
-2.69%
jan 1, 1983
15.0
-8.413
-35.93%
jan 1, 1984
18.966
+3.966
26.44%
jan 1, 1985
3.587
-15.378
-81.08%
jan 1, 1986
2.482
-1.105
-30.81%
jan 1, 1987
2.888
+0.406
16.35%
jan 1, 1988
2.456
-0.432
-14.96%
jan 1, 1989
1.869
-0.587
-23.9%
jan 1, 1990
1.515
-0.354
-18.94%
jan 1, 1991
0.765
-0.75
-49.49%
jan 1, 1992
0.499
-0.267
-34.83%
jan 1, 1993
0.257
-0.242
-48.46%
jan 1, 1994
0.0
-0.257
-100.0%
jan 1, 1996
0.256
+0.256
%
jan 1, 1997
0.239
-0.017
-6.68%
jan 1, 1998
0.0
-0.239
-100.0%
jan 1, 1999
0.268
+0.268
10456.08 trl%
jan 1, 2000
0.211
-0.057
-21.31%
jan 1, 2001
0.0
-0.211
-100.0%
jan 1, 2003
0.0
+0.0
-100.0%
jan 1, 2004
0.142
+0.142
%
jan 1, 2005
0.135
-0.007
-4.59%
jan 1, 2006
0.163
+0.027
20.33%
jan 1, 2007
0.364
+0.201
123.64%
jan 1, 2008
0.311
-0.052
-14.42%
jan 1, 2009
0.339
+0.027
8.83%
jan 1, 2010
0.288
-0.05
-14.85%
jan 1, 2011
0.265
-0.024
-8.21%
jan 1, 2012
0.249
-0.016
-6.03%
jan 1, 2013
0.285
+0.036
14.66%
jan 1, 2014
0.324
+0.039
13.77%
Ranking of countries by current statistics by years


Comments: