29
/
en
AIzaSyAYiBZKx7MnpbEhh9jyipgxe19OcubqV5w
April 1, 2024
48801
Middle East & North Africa (excluding high income)
MNA
false
2
1
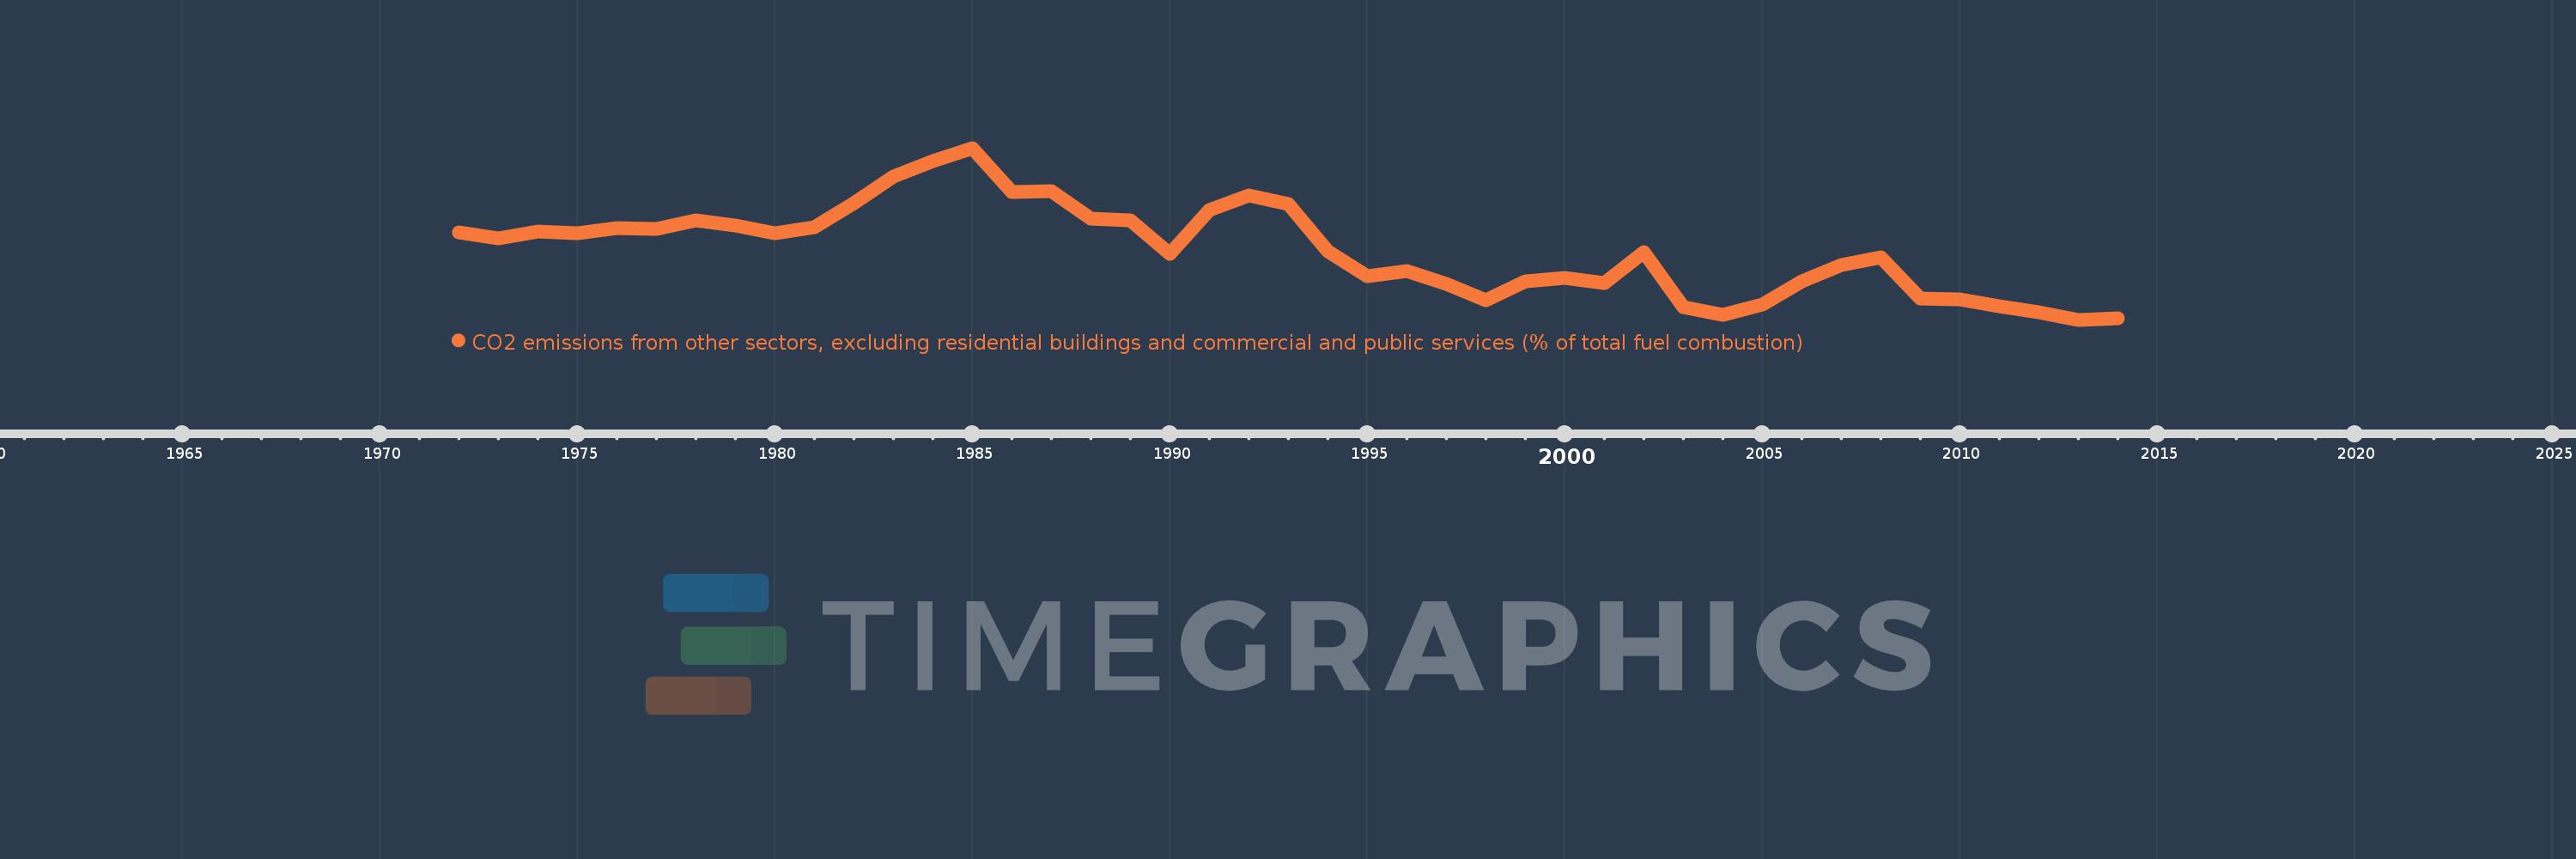
CO2 emissions from other sectors, excluding residential buildings and commercial and public services (% of total fuel combustion)
2014,2013,2012,2011,2010,2009,2008,2007,2006,2005,2004,2003,2002,2001,2000,1999,1998,1997,1996,1995,1994,1993,1992,1991,1990,1989,1988,1987,1986,1985,1984,1983,1982,1981,1980,1979,1978,1977,1976,1975,1974,1973,1972
This statistics in other country:
AlbaniaAlgeriaAngolaArab WorldArgentinaArmeniaAustraliaAustriaAzerbaijanBahrainBangladeshBelarusBelgiumBeninBoliviaBosnia and HerzegovinaBotswanaBrazilBrunei DarussalamBulgariaCambodiaCameroonCanadaCaribbean small statesCentral Europe and the BalticsChileChinaColombiaCongo, Dem. Rep.Congo, Rep.Costa RicaCote d'IvoireCroatiaCubaCuracaoCyprusCzech RepublicDenmarkDominican RepublicEarly-demographic dividendEast Asia & PacificEast Asia & Pacific (excluding high income)East Asia & Pacific (IDA & IBRD countries)EcuadorEgypt, Arab Rep.El SalvadorEritreaEstoniaEthiopiaEuro areaEurope & Central AsiaEurope & Central Asia (excluding high income)Europe & Central Asia (IDA & IBRD countries)European UnionFinlandFragile and conflict affected situationsFranceGabonGeorgiaGermanyGhanaGibraltarGreeceGuatemalaHaitiHeavily indebted poor countries (HIPC)High incomeHondurasHong Kong SAR, ChinaHungaryIBRD onlyIcelandIDA & IBRD totalIDA blendIDA onlyIDA totalIndiaIndonesiaIran, Islamic Rep.IraqIrelandIsraelItalyJamaicaJapanJordanKazakhstanKenyaKorea, Dem. People’s Rep.Korea, Rep.KosovoKuwaitKyrgyz RepublicLate-demographic dividendLatin America & Caribbean Latin America & Caribbean (excluding high income)Latin America & the Caribbean (IDA & IBRD countries)LatviaLeast developed countries: UN classificationLebanonLibyaLithuaniaLow & middle incomeLow incomeLower middle incomeLuxembourgMacedonia, FYRMalaysiaMaltaMauritiusMexicoMiddle East & North AfricaMiddle East & North Africa (excluding high income)Middle East & North Africa (IDA & IBRD countries)Middle incomeMoldovaMongoliaMontenegroMoroccoMozambiqueMyanmarNamibiaNepalNetherlandsNew ZealandNicaraguaNigerNigeriaNorth AmericaNorwayOECD membersOmanOther small statesPakistanPanamaParaguayPeruPhilippinesPolandPortugalPost-demographic dividendPre-demographic dividendQatarRomaniaRussian FederationSaudi ArabiaSenegalSerbiaSingaporeSlovak RepublicSloveniaSmall statesSouth AfricaSouth AsiaSouth Asia (IDA & IBRD)South SudanSpainSri LankaSub-Saharan Africa Sub-Saharan Africa (excluding high income)Sub-Saharan Africa (IDA & IBRD countries)SudanSwedenSwitzerlandSyrian Arab RepublicTajikistanTanzaniaThailandTogoTrinidad and TobagoTunisiaTurkeyTurkmenistanUkraineUnited Arab EmiratesUnited KingdomUnited StatesUpper middle incomeUruguayUzbekistanVenezuela, RBVietnamWorldYemen, Rep.ZambiaZimbabwe Timeline:
This timeline shows a graph from 1972 to 2014 of Middle East & North Africa (excluding high income). No data until 1971. Number of actual observations by date: 43.
Source name:
World Development Indicators
Source organization:
IEA Statistics © OECD/IEA 2014 (http://www.iea.org/stats/index.asp), subject to https://www.iea.org/t&c/termsandconditions/
Categories, topics:
Environment
Last updated:
apr 23, 2017
Indicators value changes by year
At the date of observation
Value
Absolute change
Change from previous value
jan 1, 1972
4.195
+4.195
0.0%
jan 1, 1973
4.086
-0.109
-2.6%
jan 1, 1974
4.204
+0.118
2.89%
jan 1, 1975
4.182
-0.022
-0.52%
jan 1, 1976
4.264
+0.082
1.95%
jan 1, 1977
4.253
-0.011
-0.27%
jan 1, 1978
4.404
+0.152
3.57%
jan 1, 1979
4.309
-0.095
-2.16%
jan 1, 1980
4.18
-0.129
-3.0%
jan 1, 1981
4.28
+0.1
2.4%
jan 1, 1982
4.711
+0.431
10.07%
jan 1, 1983
5.189
+0.478
10.15%
jan 1, 1984
5.458
+0.269
5.19%
jan 1, 1985
5.694
+0.235
4.31%
jan 1, 1986
4.907
-0.786
-13.81%
jan 1, 1987
4.926
+0.019
0.39%
jan 1, 1988
4.44
-0.486
-9.87%
jan 1, 1989
4.403
-0.037
-0.84%
jan 1, 1990
3.811
-0.591
-13.43%
jan 1, 1991
4.585
+0.774
20.31%
jan 1, 1992
4.856
+0.271
5.91%
jan 1, 1993
4.692
-0.164
-3.37%
jan 1, 1994
3.865
-0.827
-17.63%
jan 1, 1995
3.421
-0.444
-11.48%
jan 1, 1996
3.503
+0.081
2.37%
jan 1, 1997
3.275
-0.227
-6.49%
jan 1, 1998
2.983
-0.292
-8.93%
jan 1, 1999
3.316
+0.333
11.17%
jan 1, 2000
3.389
+0.073
2.19%
jan 1, 2001
3.289
-0.099
-2.93%
jan 1, 2002
3.848
+0.558
16.98%
jan 1, 2003
2.871
-0.977
-25.39%
jan 1, 2004
2.729
-0.142
-4.93%
jan 1, 2005
2.905
+0.175
6.42%
jan 1, 2006
3.327
+0.422
14.54%
jan 1, 2007
3.613
+0.286
8.6%
jan 1, 2008
3.751
+0.138
3.83%
jan 1, 2009
3.016
-0.736
-19.61%
jan 1, 2010
3.001
-0.015
-0.49%
jan 1, 2011
2.886
-0.115
-3.84%
jan 1, 2012
2.77
-0.116
-4.02%
jan 1, 2013
2.641
-0.129
-4.64%
jan 1, 2014
2.66
+0.019
0.7%
Ranking of countries by current statistics by years


Comments: