29
/
en
AIzaSyAYiBZKx7MnpbEhh9jyipgxe19OcubqV5w
April 1, 2024
45926
Low income
LIC
false
2
1
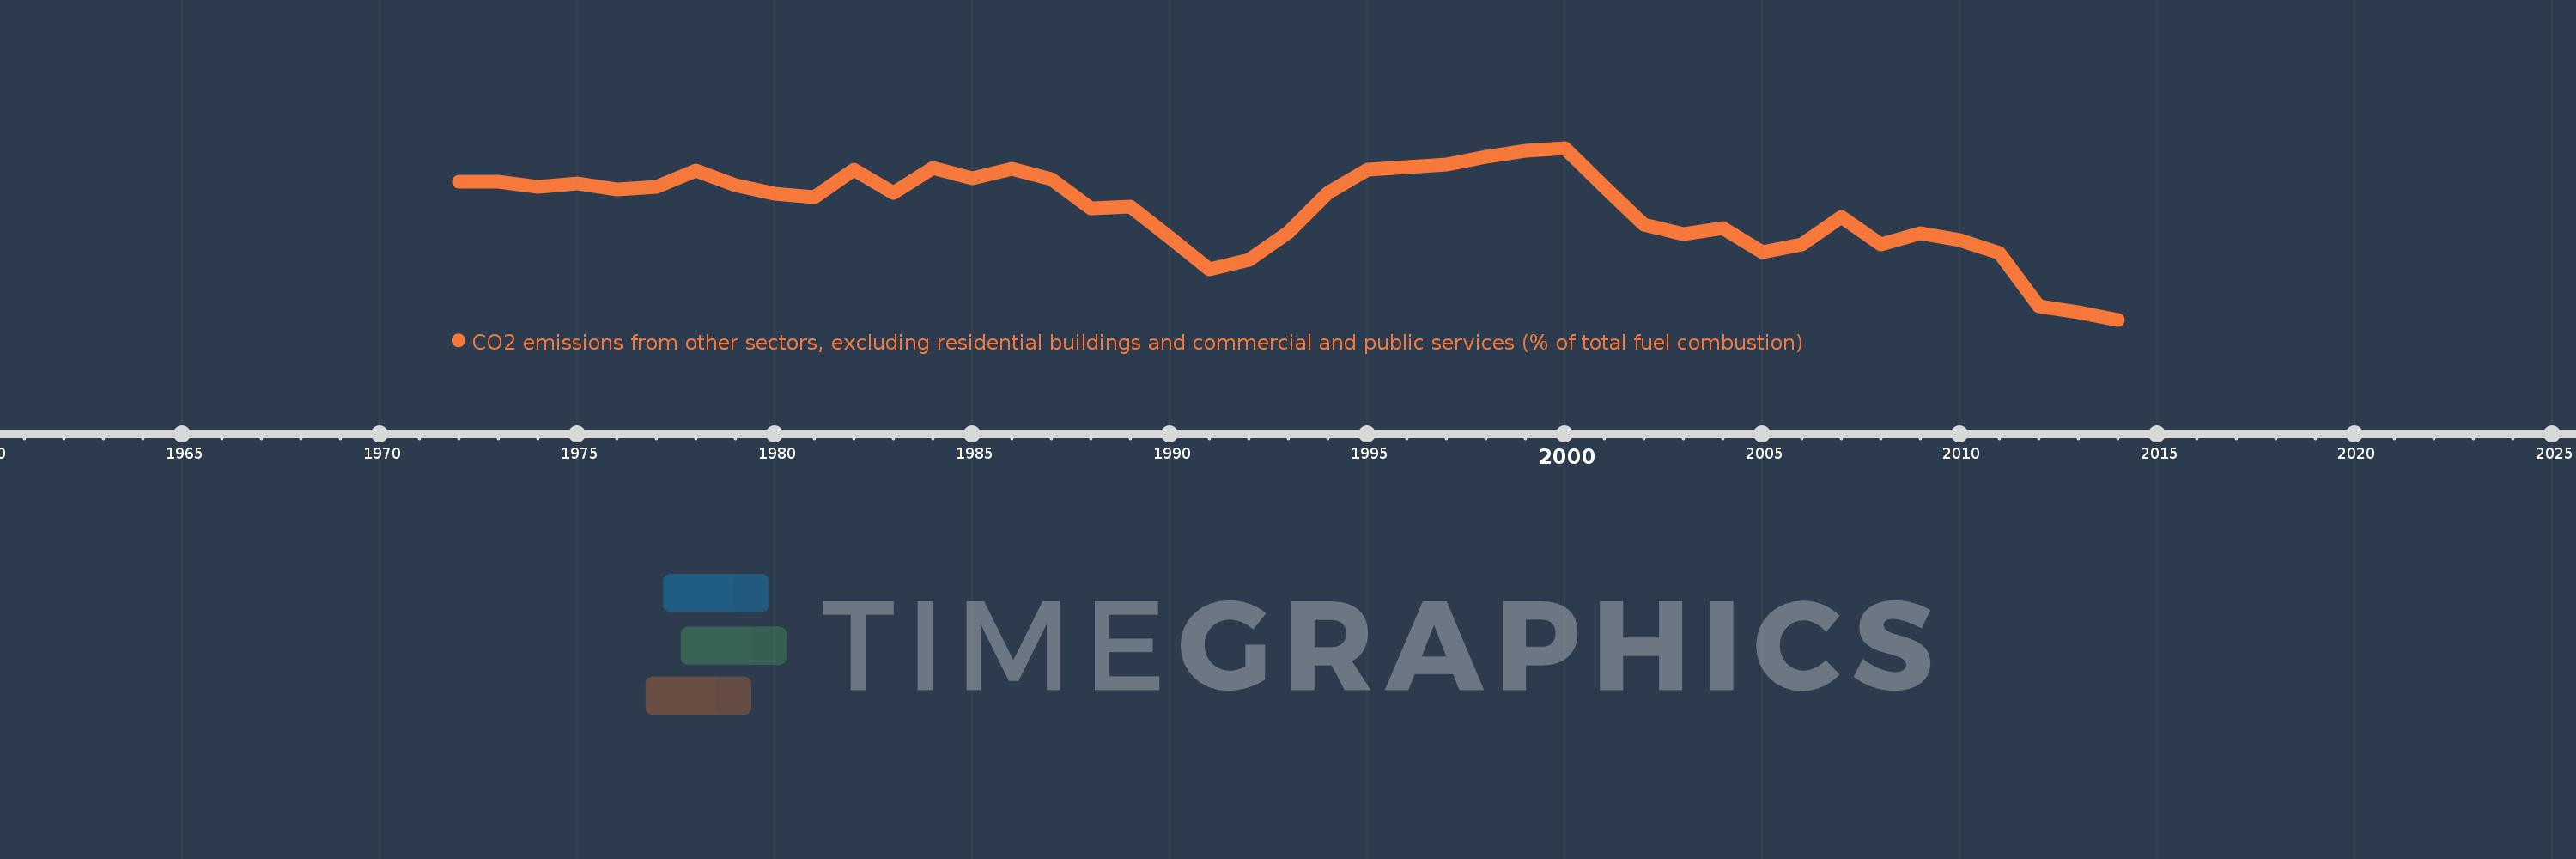
CO2 emissions from other sectors, excluding residential buildings and commercial and public services (% of total fuel combustion)
2014,2013,2012,2011,2010,2009,2008,2007,2006,2005,2004,2003,2002,2001,2000,1999,1998,1997,1996,1995,1994,1993,1992,1991,1990,1989,1988,1987,1986,1985,1984,1983,1982,1981,1980,1979,1978,1977,1976,1975,1974,1973,1972
This statistics in other country:
AlbaniaAlgeriaAngolaArab WorldArgentinaArmeniaAustraliaAustriaAzerbaijanBahrainBangladeshBelarusBelgiumBeninBoliviaBosnia and HerzegovinaBotswanaBrazilBrunei DarussalamBulgariaCambodiaCameroonCanadaCaribbean small statesCentral Europe and the BalticsChileChinaColombiaCongo, Dem. Rep.Congo, Rep.Costa RicaCote d'IvoireCroatiaCubaCuracaoCyprusCzech RepublicDenmarkDominican RepublicEarly-demographic dividendEast Asia & PacificEast Asia & Pacific (excluding high income)East Asia & Pacific (IDA & IBRD countries)EcuadorEgypt, Arab Rep.El SalvadorEritreaEstoniaEthiopiaEuro areaEurope & Central AsiaEurope & Central Asia (excluding high income)Europe & Central Asia (IDA & IBRD countries)European UnionFinlandFragile and conflict affected situationsFranceGabonGeorgiaGermanyGhanaGibraltarGreeceGuatemalaHaitiHeavily indebted poor countries (HIPC)High incomeHondurasHong Kong SAR, ChinaHungaryIBRD onlyIcelandIDA & IBRD totalIDA blendIDA onlyIDA totalIndiaIndonesiaIran, Islamic Rep.IraqIrelandIsraelItalyJamaicaJapanJordanKazakhstanKenyaKorea, Dem. People’s Rep.Korea, Rep.KosovoKuwaitKyrgyz RepublicLate-demographic dividendLatin America & Caribbean Latin America & Caribbean (excluding high income)Latin America & the Caribbean (IDA & IBRD countries)LatviaLeast developed countries: UN classificationLebanonLibyaLithuaniaLow & middle incomeLow incomeLower middle incomeLuxembourgMacedonia, FYRMalaysiaMaltaMauritiusMexicoMiddle East & North AfricaMiddle East & North Africa (excluding high income)Middle East & North Africa (IDA & IBRD countries)Middle incomeMoldovaMongoliaMontenegroMoroccoMozambiqueMyanmarNamibiaNepalNetherlandsNew ZealandNicaraguaNigerNigeriaNorth AmericaNorwayOECD membersOmanOther small statesPakistanPanamaParaguayPeruPhilippinesPolandPortugalPost-demographic dividendPre-demographic dividendQatarRomaniaRussian FederationSaudi ArabiaSenegalSerbiaSingaporeSlovak RepublicSloveniaSmall statesSouth AfricaSouth AsiaSouth Asia (IDA & IBRD)South SudanSpainSri LankaSub-Saharan Africa Sub-Saharan Africa (excluding high income)Sub-Saharan Africa (IDA & IBRD countries)SudanSwedenSwitzerlandSyrian Arab RepublicTajikistanTanzaniaThailandTogoTrinidad and TobagoTunisiaTurkeyTurkmenistanUkraineUnited Arab EmiratesUnited KingdomUnited StatesUpper middle incomeUruguayUzbekistanVenezuela, RBVietnamWorldYemen, Rep.ZambiaZimbabwe Timeline:
This timeline shows a graph from 1972 to 2014 of Low income. No data until 1971. Number of actual observations by date: 43.
Source name:
World Development Indicators
Source organization:
IEA Statistics © OECD/IEA 2014 (http://www.iea.org/stats/index.asp), subject to https://www.iea.org/t&c/termsandconditions/
Categories, topics:
Environment
Last updated:
apr 23, 2017
Indicators value changes by year
Minimum:
12.139
jan 1, 2014
Maximum:
16.987
jan 1, 2000
At the date of observation
Value
Absolute change
Change from previous value
jan 1, 1972
16.024
+16.024
0.0%
jan 1, 1973
16.043
+0.019
0.12%
jan 1, 1974
15.899
-0.143
-0.89%
jan 1, 1975
15.998
+0.099
0.62%
jan 1, 1976
15.806
-0.192
-1.2%
jan 1, 1977
15.889
+0.082
0.52%
jan 1, 1978
16.35
+0.461
2.9%
jan 1, 1979
15.934
-0.416
-2.54%
jan 1, 1980
15.698
-0.236
-1.48%
jan 1, 1981
15.588
-0.11
-0.7%
jan 1, 1982
16.372
+0.784
5.03%
jan 1, 1983
15.716
-0.656
-4.0%
jan 1, 1984
16.423
+0.706
4.49%
jan 1, 1985
16.13
-0.293
-1.78%
jan 1, 1986
16.404
+0.274
1.7%
jan 1, 1987
16.114
-0.29
-1.77%
jan 1, 1988
15.275
-0.838
-5.2%
jan 1, 1989
15.333
+0.058
0.38%
jan 1, 1990
14.448
-0.886
-5.78%
jan 1, 1991
13.555
-0.893
-6.18%
jan 1, 1992
13.835
+0.28
2.07%
jan 1, 1993
14.596
+0.761
5.5%
jan 1, 1994
15.717
+1.121
7.68%
jan 1, 1995
16.38
+0.663
4.22%
jan 1, 1996
16.456
+0.077
0.47%
jan 1, 1997
16.526
+0.07
0.42%
jan 1, 1998
16.746
+0.22
1.33%
jan 1, 1999
16.908
+0.163
0.97%
jan 1, 2000
16.987
+0.079
0.46%
jan 1, 2001
15.886
-1.101
-6.48%
jan 1, 2002
14.833
-1.052
-6.62%
jan 1, 2003
14.546
-0.288
-1.94%
jan 1, 2004
14.721
+0.175
1.2%
jan 1, 2005
14.057
-0.663
-4.5%
jan 1, 2006
14.259
+0.202
1.43%
jan 1, 2007
15.04
+0.781
5.47%
jan 1, 2008
14.255
-0.784
-5.22%
jan 1, 2009
14.584
+0.328
2.3%
jan 1, 2010
14.381
-0.202
-1.39%
jan 1, 2011
14.031
-0.35
-2.44%
jan 1, 2012
12.527
-1.504
-10.72%
jan 1, 2013
12.359
-0.168
-1.34%
jan 1, 2014
12.139
-0.22
-1.78%
Ranking of countries by current statistics by years


Comments: