29
/
en
AIzaSyAYiBZKx7MnpbEhh9jyipgxe19OcubqV5w
April 1, 2024
261990
Thailand
THA
true
2
1
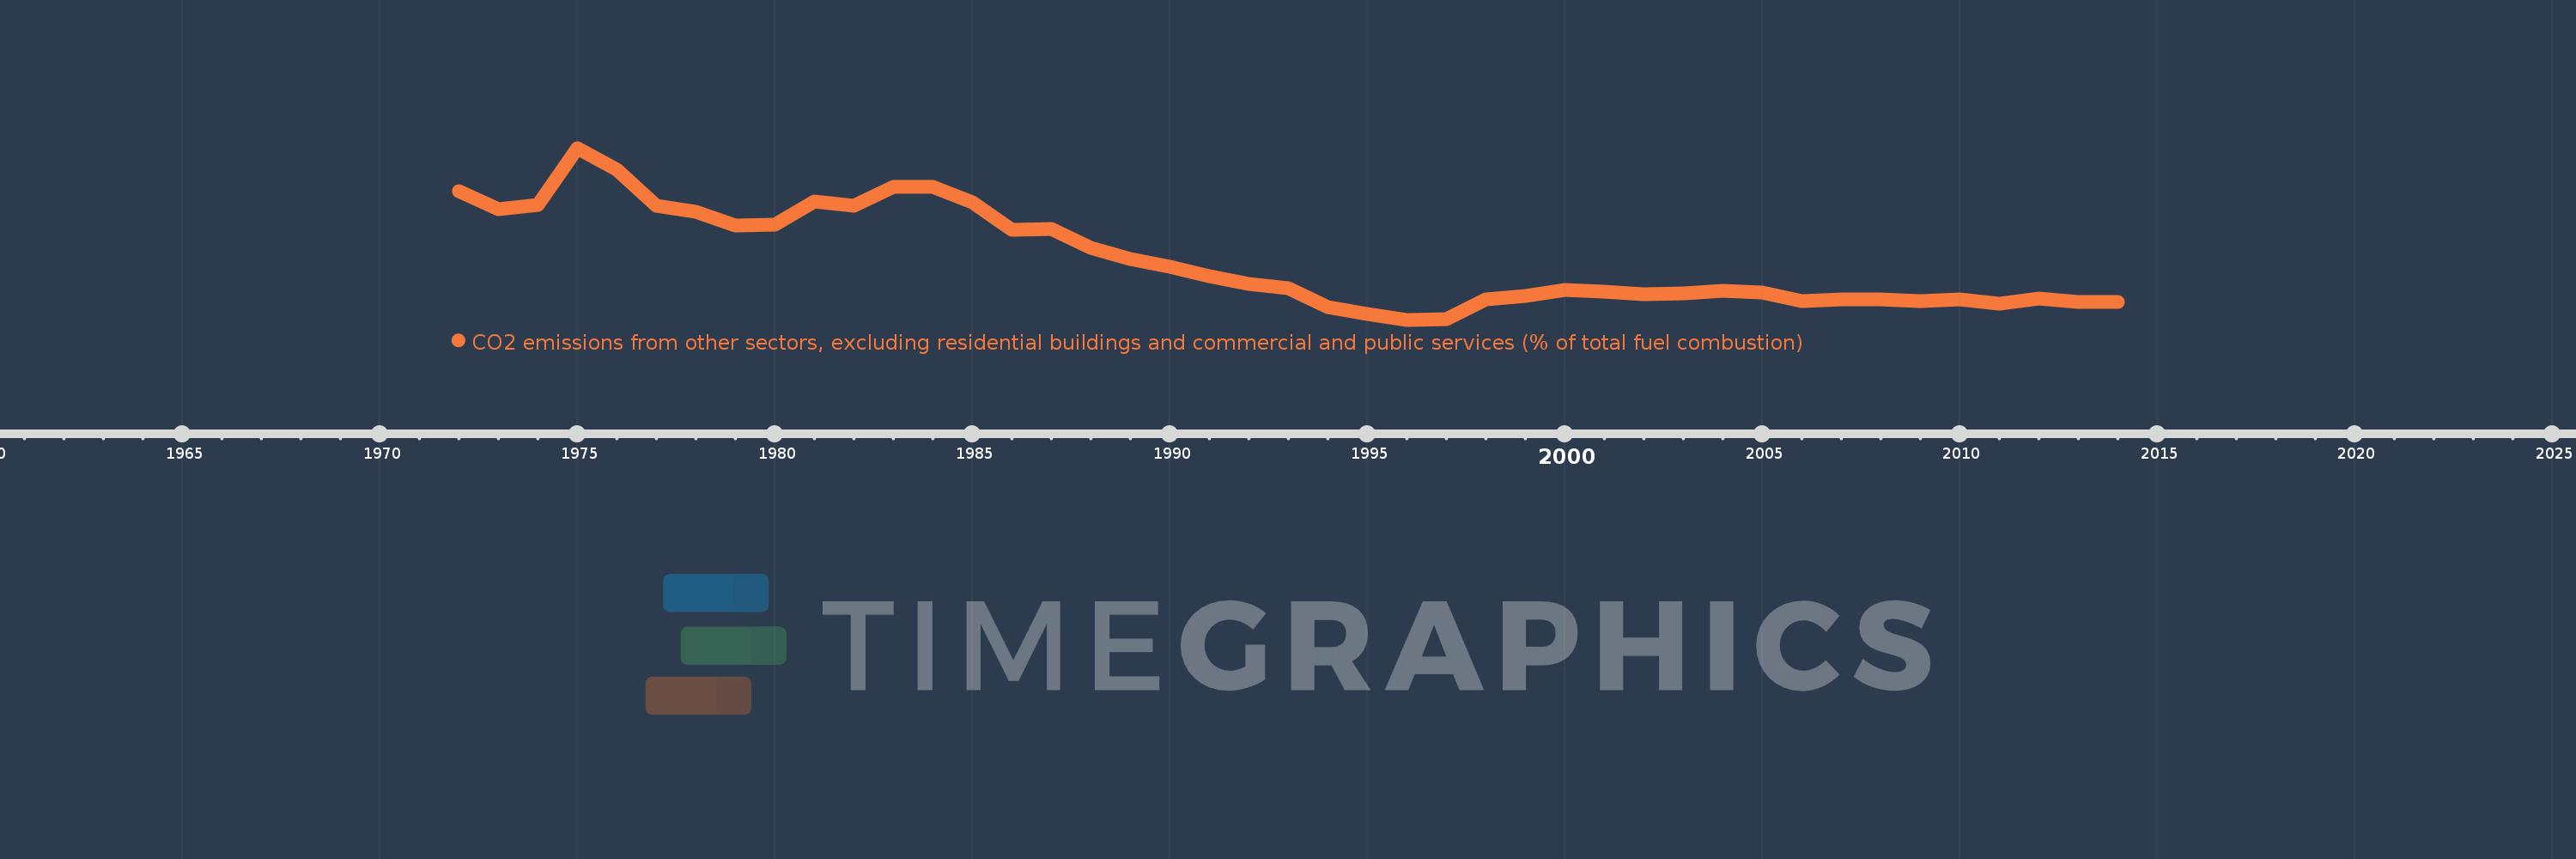
CO2 emissions from other sectors, excluding residential buildings and commercial and public services (% of total fuel combustion)
2014,2013,2012,2011,2010,2009,2008,2007,2006,2005,2004,2003,2002,2001,2000,1999,1998,1997,1996,1995,1994,1993,1992,1991,1990,1989,1988,1987,1986,1985,1984,1983,1982,1981,1980,1979,1978,1977,1976,1975,1974,1973,1972
Global statistics library →Thailand →CO2 emissions from other sectors, excluding residential buildings and commercial and public services (% of total fuel combustion)
This statistics in other country:
AlbaniaAlgeriaAngolaArab WorldArgentinaArmeniaAustraliaAustriaAzerbaijanBahrainBangladeshBelarusBelgiumBeninBoliviaBosnia and HerzegovinaBotswanaBrazilBrunei DarussalamBulgariaCambodiaCameroonCanadaCaribbean small statesCentral Europe and the BalticsChileChinaColombiaCongo, Dem. Rep.Congo, Rep.Costa RicaCote d'IvoireCroatiaCubaCuracaoCyprusCzech RepublicDenmarkDominican RepublicEarly-demographic dividendEast Asia & PacificEast Asia & Pacific (excluding high income)East Asia & Pacific (IDA & IBRD countries)EcuadorEgypt, Arab Rep.El SalvadorEritreaEstoniaEthiopiaEuro areaEurope & Central AsiaEurope & Central Asia (excluding high income)Europe & Central Asia (IDA & IBRD countries)European UnionFinlandFragile and conflict affected situationsFranceGabonGeorgiaGermanyGhanaGibraltarGreeceGuatemalaHaitiHeavily indebted poor countries (HIPC)High incomeHondurasHong Kong SAR, ChinaHungaryIBRD onlyIcelandIDA & IBRD totalIDA blendIDA onlyIDA totalIndiaIndonesiaIran, Islamic Rep.IraqIrelandIsraelItalyJamaicaJapanJordanKazakhstanKenyaKorea, Dem. People’s Rep.Korea, Rep.KosovoKuwaitKyrgyz RepublicLate-demographic dividendLatin America & Caribbean Latin America & Caribbean (excluding high income)Latin America & the Caribbean (IDA & IBRD countries)LatviaLeast developed countries: UN classificationLebanonLibyaLithuaniaLow & middle incomeLow incomeLower middle incomeLuxembourgMacedonia, FYRMalaysiaMaltaMauritiusMexicoMiddle East & North AfricaMiddle East & North Africa (excluding high income)Middle East & North Africa (IDA & IBRD countries)Middle incomeMoldovaMongoliaMontenegroMoroccoMozambiqueMyanmarNamibiaNepalNetherlandsNew ZealandNicaraguaNigerNigeriaNorth AmericaNorwayOECD membersOmanOther small statesPakistanPanamaParaguayPeruPhilippinesPolandPortugalPost-demographic dividendPre-demographic dividendQatarRomaniaRussian FederationSaudi ArabiaSenegalSerbiaSingaporeSlovak RepublicSloveniaSmall statesSouth AfricaSouth AsiaSouth Asia (IDA & IBRD)South SudanSpainSri LankaSub-Saharan Africa Sub-Saharan Africa (excluding high income)Sub-Saharan Africa (IDA & IBRD countries)SudanSwedenSwitzerlandSyrian Arab RepublicTajikistanTanzaniaThailandTogoTrinidad and TobagoTunisiaTurkeyTurkmenistanUkraineUnited Arab EmiratesUnited KingdomUnited StatesUpper middle incomeUruguayUzbekistanVenezuela, RBVietnamWorldYemen, Rep.ZambiaZimbabwe Timeline:
This timeline shows a graph from 1972 to 2014 of Thailand. No data until 1971. Number of actual observations by date: 43.
Source name:
World Development Indicators
Source organization:
IEA Statistics © OECD/IEA 2014 (http://www.iea.org/stats/index.asp), subject to https://www.iea.org/t&c/termsandconditions/
Categories, topics:
Environment
Last updated:
apr 23, 2017
Indicators value changes by year
Maximum:
17.103
jan 1, 1975
At the date of observation
Value
Absolute change
Change from previous value
jan 1, 1972
13.67
+13.67
0.0%
jan 1, 1973
12.261
-1.409
-10.31%
jan 1, 1974
12.603
+0.342
2.79%
jan 1, 1975
17.103
+4.5
35.71%
jan 1, 1976
15.374
-1.729
-10.11%
jan 1, 1977
12.526
-2.848
-18.52%
jan 1, 1978
12.079
-0.447
-3.57%
jan 1, 1979
10.933
-1.146
-9.49%
jan 1, 1980
11.004
+0.07
0.64%
jan 1, 1981
12.837
+1.833
16.66%
jan 1, 1982
12.504
-0.333
-2.6%
jan 1, 1983
14.01
+1.506
12.05%
jan 1, 1984
13.992
-0.018
-0.13%
jan 1, 1985
12.767
-1.226
-8.76%
jan 1, 1986
10.651
-2.115
-16.57%
jan 1, 1987
10.696
+0.045
0.42%
jan 1, 1988
9.16
-1.536
-14.36%
jan 1, 1989
8.282
-0.878
-9.58%
jan 1, 1990
7.691
-0.591
-7.14%
jan 1, 1991
6.935
-0.756
-9.83%
jan 1, 1992
6.321
-0.615
-8.86%
jan 1, 1993
5.999
-0.322
-5.09%
jan 1, 1994
4.527
-1.472
-24.53%
jan 1, 1995
3.975
-0.553
-12.21%
jan 1, 1996
3.494
-0.481
-12.09%
jan 1, 1997
3.532
+0.038
1.09%
jan 1, 1998
5.094
+1.562
44.21%
jan 1, 1999
5.382
+0.288
5.66%
jan 1, 2000
5.853
+0.47
8.74%
jan 1, 2001
5.7
-0.153
-2.61%
jan 1, 2002
5.531
-0.168
-2.95%
jan 1, 2003
5.56
+0.029
0.53%
jan 1, 2004
5.799
+0.238
4.28%
jan 1, 2005
5.64
-0.159
-2.74%
jan 1, 2006
4.98
-0.66
-11.69%
jan 1, 2007
5.102
+0.122
2.46%
jan 1, 2008
5.109
+0.006
0.13%
jan 1, 2009
4.973
-0.136
-2.66%
jan 1, 2010
5.077
+0.104
2.1%
jan 1, 2011
4.776
-0.301
-5.93%
jan 1, 2012
5.163
+0.387
8.1%
jan 1, 2013
4.926
-0.237
-4.6%
jan 1, 2014
4.914
-0.011
-0.23%
Ranking of countries by current statistics by years


Comments: