29
/
en
AIzaSyAYiBZKx7MnpbEhh9jyipgxe19OcubqV5w
April 1, 2024
69689
Argentina
ARG
true
2
1
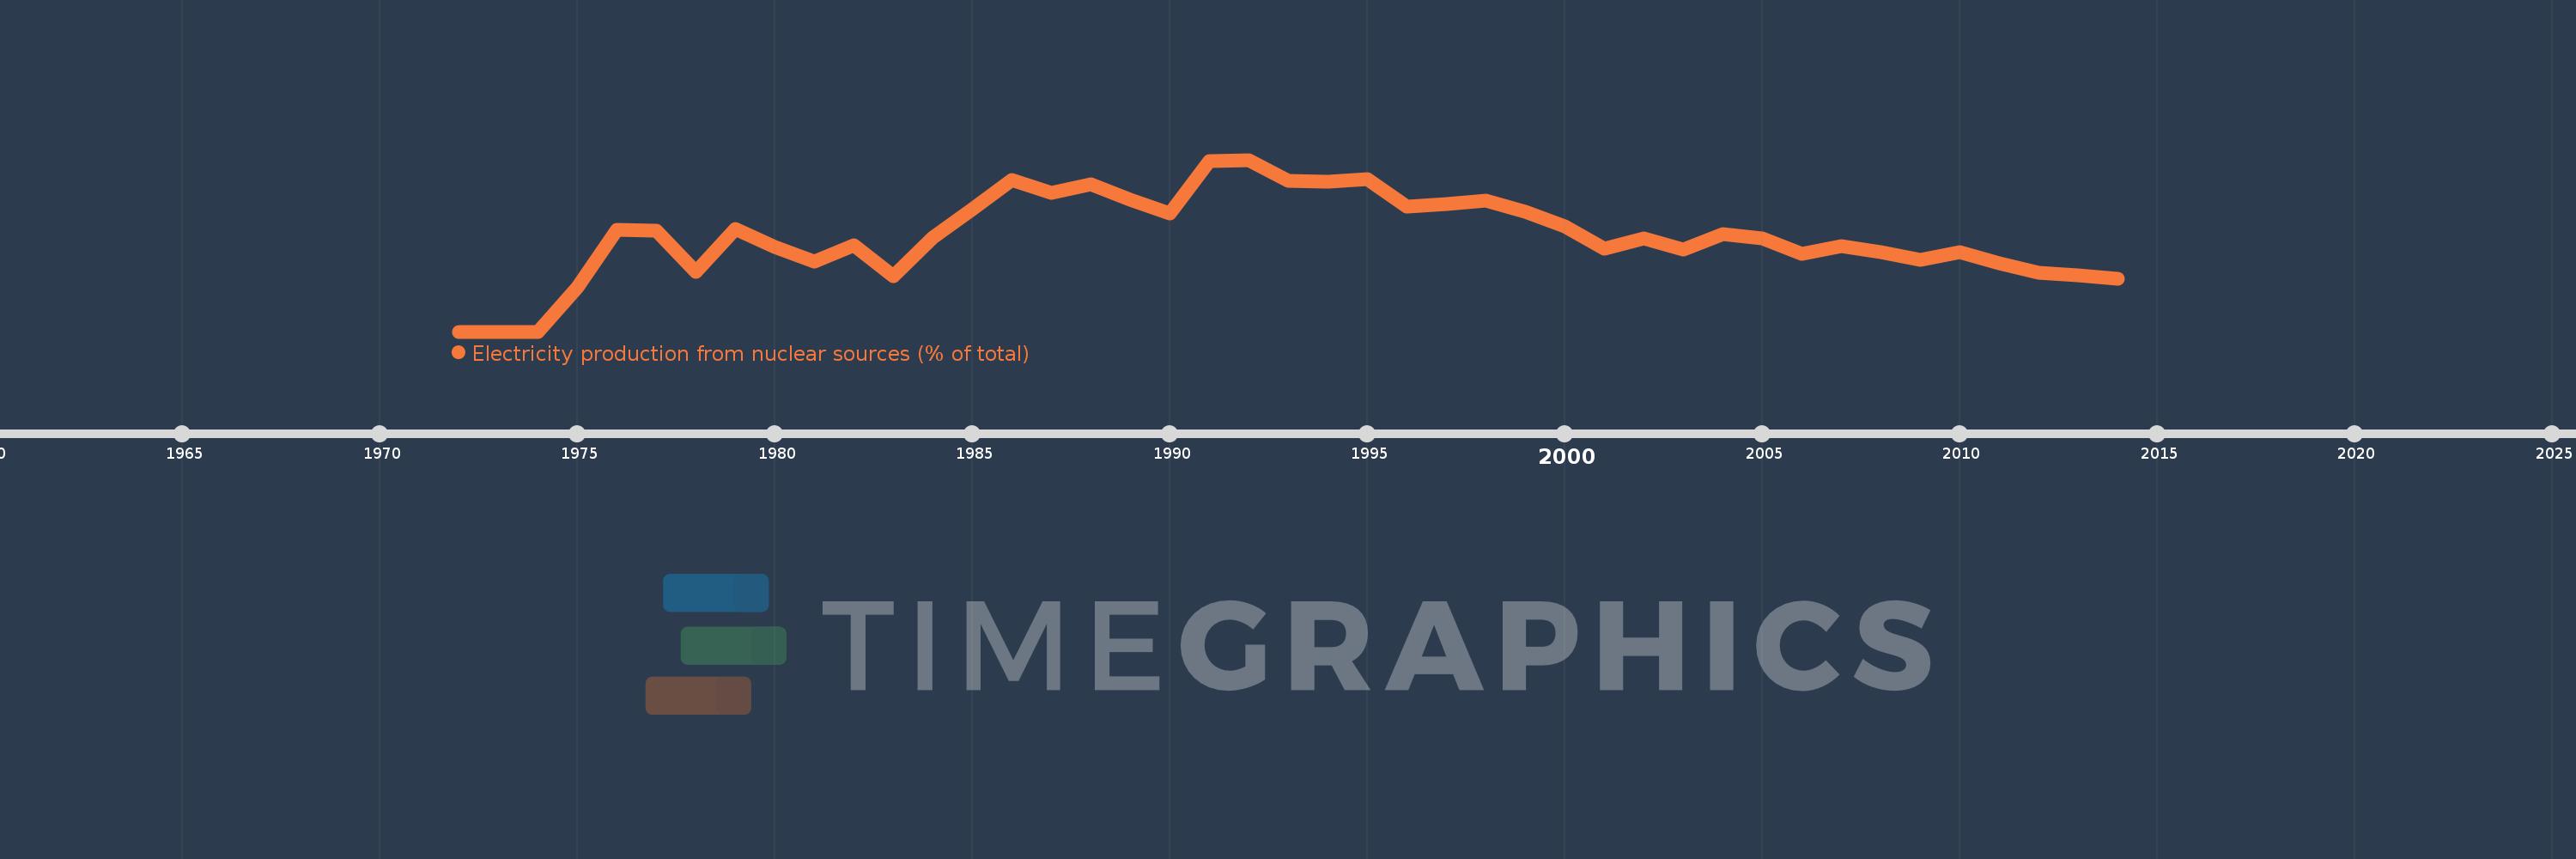
Electricity production from nuclear sources (% of total)
2014,2013,2012,2011,2010,2009,2008,2007,2006,2005,2004,2003,2002,2001,2000,1999,1998,1997,1996,1995,1994,1993,1992,1991,1990,1989,1988,1987,1986,1985,1984,1983,1982,1981,1980,1979,1978,1977,1976,1975,1974,1973,1972
This statistics in other country:
AlbaniaAlgeriaAngolaArab WorldArgentinaArmeniaAustraliaAustriaAzerbaijanBahrainBangladeshBelarusBelgiumBeninBoliviaBosnia and HerzegovinaBotswanaBrazilBrunei DarussalamBulgariaCambodiaCameroonCanadaCentral Europe and the BalticsChileChinaColombiaCongo, Dem. Rep.Congo, Rep.Costa RicaCote d'IvoireCroatiaCubaCuracaoCyprusCzech RepublicDenmarkDominican RepublicEarly-demographic dividendEast Asia & PacificEast Asia & Pacific (excluding high income)East Asia & Pacific (IDA & IBRD countries)EcuadorEgypt, Arab Rep.El SalvadorEritreaEstoniaEthiopiaEuro areaEurope & Central AsiaEurope & Central Asia (excluding high income)Europe & Central Asia (IDA & IBRD countries)European UnionFinlandFragile and conflict affected situationsFranceGabonGeorgiaGermanyGhanaGibraltarGreeceGuatemalaHaitiHeavily indebted poor countries (HIPC)High incomeHondurasHong Kong SAR, ChinaHungaryIBRD onlyIcelandIDA & IBRD totalIDA blendIDA onlyIDA totalIndiaIndonesiaIran, Islamic Rep.IraqIrelandIsraelItalyJamaicaJapanJordanKazakhstanKenyaKorea, Dem. People’s Rep.Korea, Rep.KosovoKuwaitKyrgyz RepublicLate-demographic dividendLatin America & Caribbean Latin America & Caribbean (excluding high income)Latin America & the Caribbean (IDA & IBRD countries)LatviaLeast developed countries: UN classificationLebanonLibyaLithuaniaLow & middle incomeLower middle incomeLuxembourgMacedonia, FYRMalaysiaMaltaMauritiusMexicoMiddle East & North AfricaMiddle East & North Africa (excluding high income)Middle East & North Africa (IDA & IBRD countries)Middle incomeMoldovaMongoliaMontenegroMoroccoMozambiqueMyanmarNamibiaNepalNetherlandsNew ZealandNicaraguaNigerNigeriaNorth AmericaNorwayOECD membersOmanOther small statesPakistanPanamaParaguayPeruPhilippinesPolandPortugalPost-demographic dividendPre-demographic dividendQatarRomaniaRussian FederationSaudi ArabiaSenegalSerbiaSingaporeSlovak RepublicSloveniaSmall statesSouth AfricaSouth AsiaSouth Asia (IDA & IBRD)South SudanSpainSri LankaSub-Saharan Africa Sub-Saharan Africa (excluding high income)Sub-Saharan Africa (IDA & IBRD countries)SudanSwedenSwitzerlandSyrian Arab RepublicTajikistanTanzaniaThailandTogoTrinidad and TobagoTunisiaTurkeyTurkmenistanUkraineUnited Arab EmiratesUnited KingdomUnited StatesUpper middle incomeUruguayUzbekistanVenezuela, RBVietnamWorldYemen, Rep.ZambiaZimbabwe Timeline:
This timeline shows a graph from 1972 to 2014 of Argentina. No data until 1971. Number of actual observations by date: 43.
Source name:
World Development Indicators
Source organization:
IEA Statistics © OECD/IEA 2014 (http://www.iea.org/stats/index.asp), subject to https://www.iea.org/t&c/termsandconditions/
Categories, topics:
Energy & Mining, Climate Change, Infrastructure
Last updated:
apr 23, 2017
Indicators value changes by year
Maximum:
14.464
jan 1, 1992
At the date of observation
Value
Absolute change
Change from previous value
jan 1, 1975
3.707
+3.707
%
jan 1, 1976
8.578
+4.871
131.42%
jan 1, 1977
8.512
-0.066
-0.77%
jan 1, 1978
5.05
-3.462
-40.67%
jan 1, 1979
8.662
+3.611
71.51%
jan 1, 1980
7.152
-1.51
-17.43%
jan 1, 1981
5.893
-1.258
-17.6%
jan 1, 1982
7.25
+1.357
23.03%
jan 1, 1983
4.688
-2.562
-35.34%
jan 1, 1984
7.918
+3.23
68.89%
jan 1, 1985
10.321
+2.403
30.35%
jan 1, 1986
12.738
+2.417
23.42%
jan 1, 1987
11.654
-1.084
-8.51%
jan 1, 1988
12.423
+0.769
6.6%
jan 1, 1989
11.098
-1.326
-10.67%
jan 1, 1990
9.976
-1.121
-10.11%
jan 1, 1991
14.35
+4.374
43.84%
jan 1, 1992
14.464
+0.114
0.8%
jan 1, 1993
12.672
-1.792
-12.39%
jan 1, 1994
12.586
-0.085
-0.67%
jan 1, 1995
12.829
+0.243
1.93%
jan 1, 1996
10.544
-2.285
-17.81%
jan 1, 1997
10.704
+0.16
1.52%
jan 1, 1998
11.011
+0.308
2.87%
jan 1, 1999
10.07
-0.941
-8.55%
jan 1, 2000
8.831
-1.239
-12.3%
jan 1, 2001
6.947
-1.883
-21.33%
jan 1, 2002
7.833
+0.886
12.75%
jan 1, 2003
6.893
-0.941
-12.01%
jan 1, 2004
8.221
+1.329
19.28%
jan 1, 2005
7.856
-0.365
-4.44%
jan 1, 2006
6.515
-1.341
-17.07%
jan 1, 2007
7.197
+0.681
10.46%
jan 1, 2008
6.719
-0.478
-6.64%
jan 1, 2009
6.028
-0.691
-10.29%
jan 1, 2010
6.694
+0.666
11.05%
jan 1, 2011
5.725
-0.969
-14.48%
jan 1, 2012
4.918
-0.807
-14.1%
jan 1, 2013
4.745
-0.173
-3.51%
jan 1, 2014
4.483
-0.262
-5.52%
Ranking of countries by current statistics by years


Comments: