29
/
en
AIzaSyAYiBZKx7MnpbEhh9jyipgxe19OcubqV5w
April 1, 2024
27203
East Asia & Pacific
EAS
false
2
1
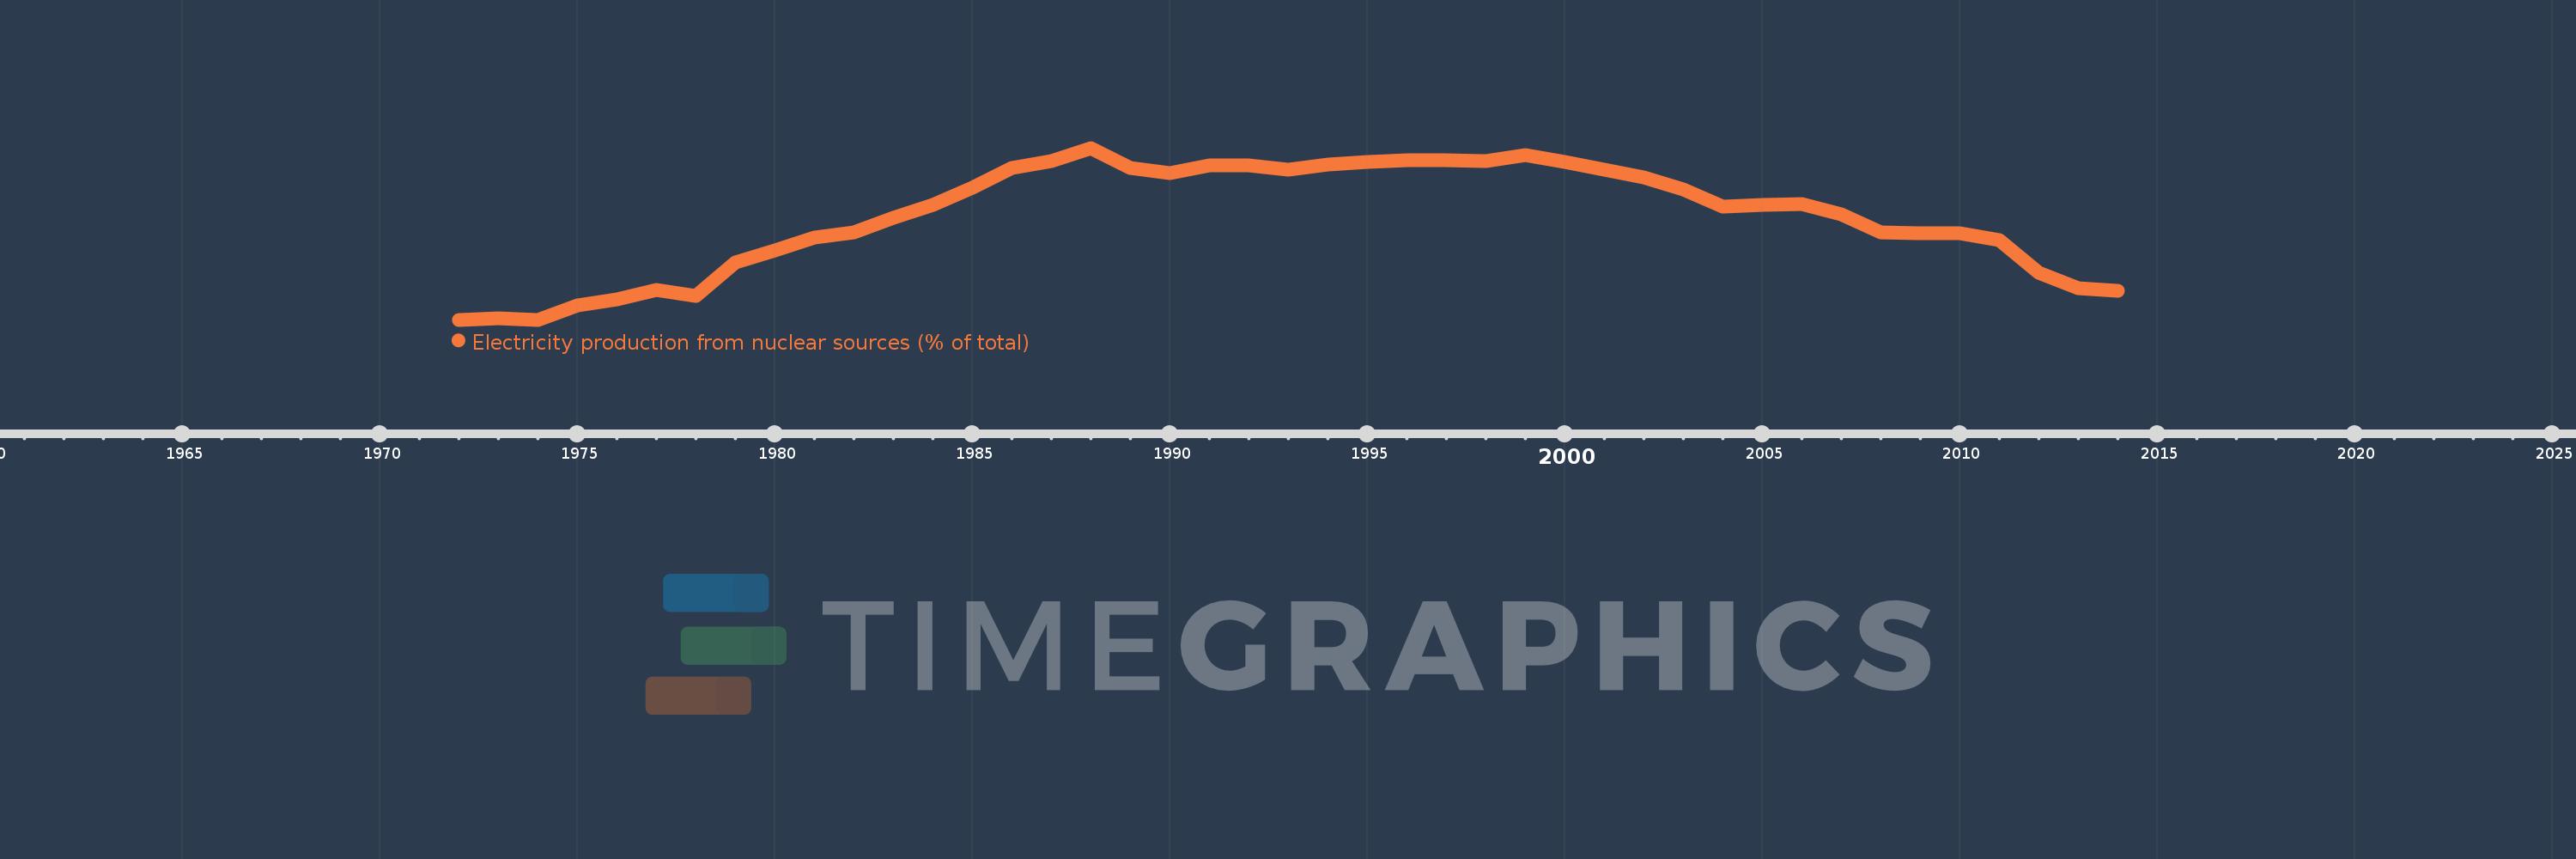
Electricity production from nuclear sources (% of total)
2014,2013,2012,2011,2010,2009,2008,2007,2006,2005,2004,2003,2002,2001,2000,1999,1998,1997,1996,1995,1994,1993,1992,1991,1990,1989,1988,1987,1986,1985,1984,1983,1982,1981,1980,1979,1978,1977,1976,1975,1974,1973,1972
This statistics in other country:
AlbaniaAlgeriaAngolaArab WorldArgentinaArmeniaAustraliaAustriaAzerbaijanBahrainBangladeshBelarusBelgiumBeninBoliviaBosnia and HerzegovinaBotswanaBrazilBrunei DarussalamBulgariaCambodiaCameroonCanadaCentral Europe and the BalticsChileChinaColombiaCongo, Dem. Rep.Congo, Rep.Costa RicaCote d'IvoireCroatiaCubaCuracaoCyprusCzech RepublicDenmarkDominican RepublicEarly-demographic dividendEast Asia & PacificEast Asia & Pacific (excluding high income)East Asia & Pacific (IDA & IBRD countries)EcuadorEgypt, Arab Rep.El SalvadorEritreaEstoniaEthiopiaEuro areaEurope & Central AsiaEurope & Central Asia (excluding high income)Europe & Central Asia (IDA & IBRD countries)European UnionFinlandFragile and conflict affected situationsFranceGabonGeorgiaGermanyGhanaGibraltarGreeceGuatemalaHaitiHeavily indebted poor countries (HIPC)High incomeHondurasHong Kong SAR, ChinaHungaryIBRD onlyIcelandIDA & IBRD totalIDA blendIDA onlyIDA totalIndiaIndonesiaIran, Islamic Rep.IraqIrelandIsraelItalyJamaicaJapanJordanKazakhstanKenyaKorea, Dem. People’s Rep.Korea, Rep.KosovoKuwaitKyrgyz RepublicLate-demographic dividendLatin America & Caribbean Latin America & Caribbean (excluding high income)Latin America & the Caribbean (IDA & IBRD countries)LatviaLeast developed countries: UN classificationLebanonLibyaLithuaniaLow & middle incomeLower middle incomeLuxembourgMacedonia, FYRMalaysiaMaltaMauritiusMexicoMiddle East & North AfricaMiddle East & North Africa (excluding high income)Middle East & North Africa (IDA & IBRD countries)Middle incomeMoldovaMongoliaMontenegroMoroccoMozambiqueMyanmarNamibiaNepalNetherlandsNew ZealandNicaraguaNigerNigeriaNorth AmericaNorwayOECD membersOmanOther small statesPakistanPanamaParaguayPeruPhilippinesPolandPortugalPost-demographic dividendPre-demographic dividendQatarRomaniaRussian FederationSaudi ArabiaSenegalSerbiaSingaporeSlovak RepublicSloveniaSmall statesSouth AfricaSouth AsiaSouth Asia (IDA & IBRD)South SudanSpainSri LankaSub-Saharan Africa Sub-Saharan Africa (excluding high income)Sub-Saharan Africa (IDA & IBRD countries)SudanSwedenSwitzerlandSyrian Arab RepublicTajikistanTanzaniaThailandTogoTrinidad and TobagoTunisiaTurkeyTurkmenistanUkraineUnited Arab EmiratesUnited KingdomUnited StatesUpper middle incomeUruguayUzbekistanVenezuela, RBVietnamWorldYemen, Rep.ZambiaZimbabwe Timeline:
This timeline shows a graph from 1972 to 2014 of East Asia & Pacific. No data until 1971. Number of actual observations by date: 43.
Source name:
World Development Indicators
Source organization:
IEA Statistics © OECD/IEA 2014 (http://www.iea.org/stats/index.asp), subject to https://www.iea.org/t&c/termsandconditions/
Categories, topics:
Energy & Mining, Climate Change, Infrastructure
Last updated:
apr 23, 2017
Indicators value changes by year
Maximum:
15.444
jan 1, 1988
At the date of observation
Value
Absolute change
Change from previous value
jan 1, 1972
1.199
+1.199
0.0%
jan 1, 1973
1.287
+0.088
7.31%
jan 1, 1974
1.19
-0.097
-7.51%
jan 1, 1975
2.405
+1.215
102.08%
jan 1, 1976
2.857
+0.451
18.77%
jan 1, 1977
3.634
+0.777
27.2%
jan 1, 1978
3.184
-0.45
-12.37%
jan 1, 1979
5.958
+2.774
87.14%
jan 1, 1980
6.936
+0.977
16.4%
jan 1, 1981
8.026
+1.091
15.72%
jan 1, 1982
8.403
+0.377
4.7%
jan 1, 1983
9.632
+1.229
14.62%
jan 1, 1984
10.747
+1.115
11.58%
jan 1, 1985
12.167
+1.42
13.21%
jan 1, 1986
13.816
+1.648
13.55%
jan 1, 1987
14.36
+0.544
3.94%
jan 1, 1988
15.444
+1.084
7.55%
jan 1, 1989
13.777
-1.666
-10.79%
jan 1, 1990
13.33
-0.447
-3.25%
jan 1, 1991
13.979
+0.649
4.87%
jan 1, 1992
13.977
-0.002
-0.02%
jan 1, 1993
13.62
-0.357
-2.55%
jan 1, 1994
14.038
+0.418
3.07%
jan 1, 1995
14.276
+0.238
1.7%
jan 1, 1996
14.441
+0.165
1.16%
jan 1, 1997
14.401
-0.04
-0.28%
jan 1, 1998
14.365
-0.036
-0.25%
jan 1, 1999
14.884
+0.52
3.62%
jan 1, 2000
14.252
-0.633
-4.25%
jan 1, 2001
13.648
-0.604
-4.24%
jan 1, 2002
12.985
-0.663
-4.85%
jan 1, 2003
12.0
-0.985
-7.59%
jan 1, 2004
10.543
-1.458
-12.15%
jan 1, 2005
10.735
+0.193
1.83%
jan 1, 2006
10.756
+0.021
0.2%
jan 1, 2007
9.958
-0.799
-7.43%
jan 1, 2008
8.466
-1.491
-14.98%
jan 1, 2009
8.363
-0.103
-1.22%
jan 1, 2010
8.338
-0.026
-0.31%
jan 1, 2011
7.765
-0.573
-6.87%
jan 1, 2012
5.056
-2.709
-34.89%
jan 1, 2013
3.834
-1.222
-24.16%
jan 1, 2014
3.575
-0.259
-6.76%
Ranking of countries by current statistics by years


Comments: