29
/
en
AIzaSyAYiBZKx7MnpbEhh9jyipgxe19OcubqV5w
April 1, 2024
50817
Middle income
MIC
false
2
1
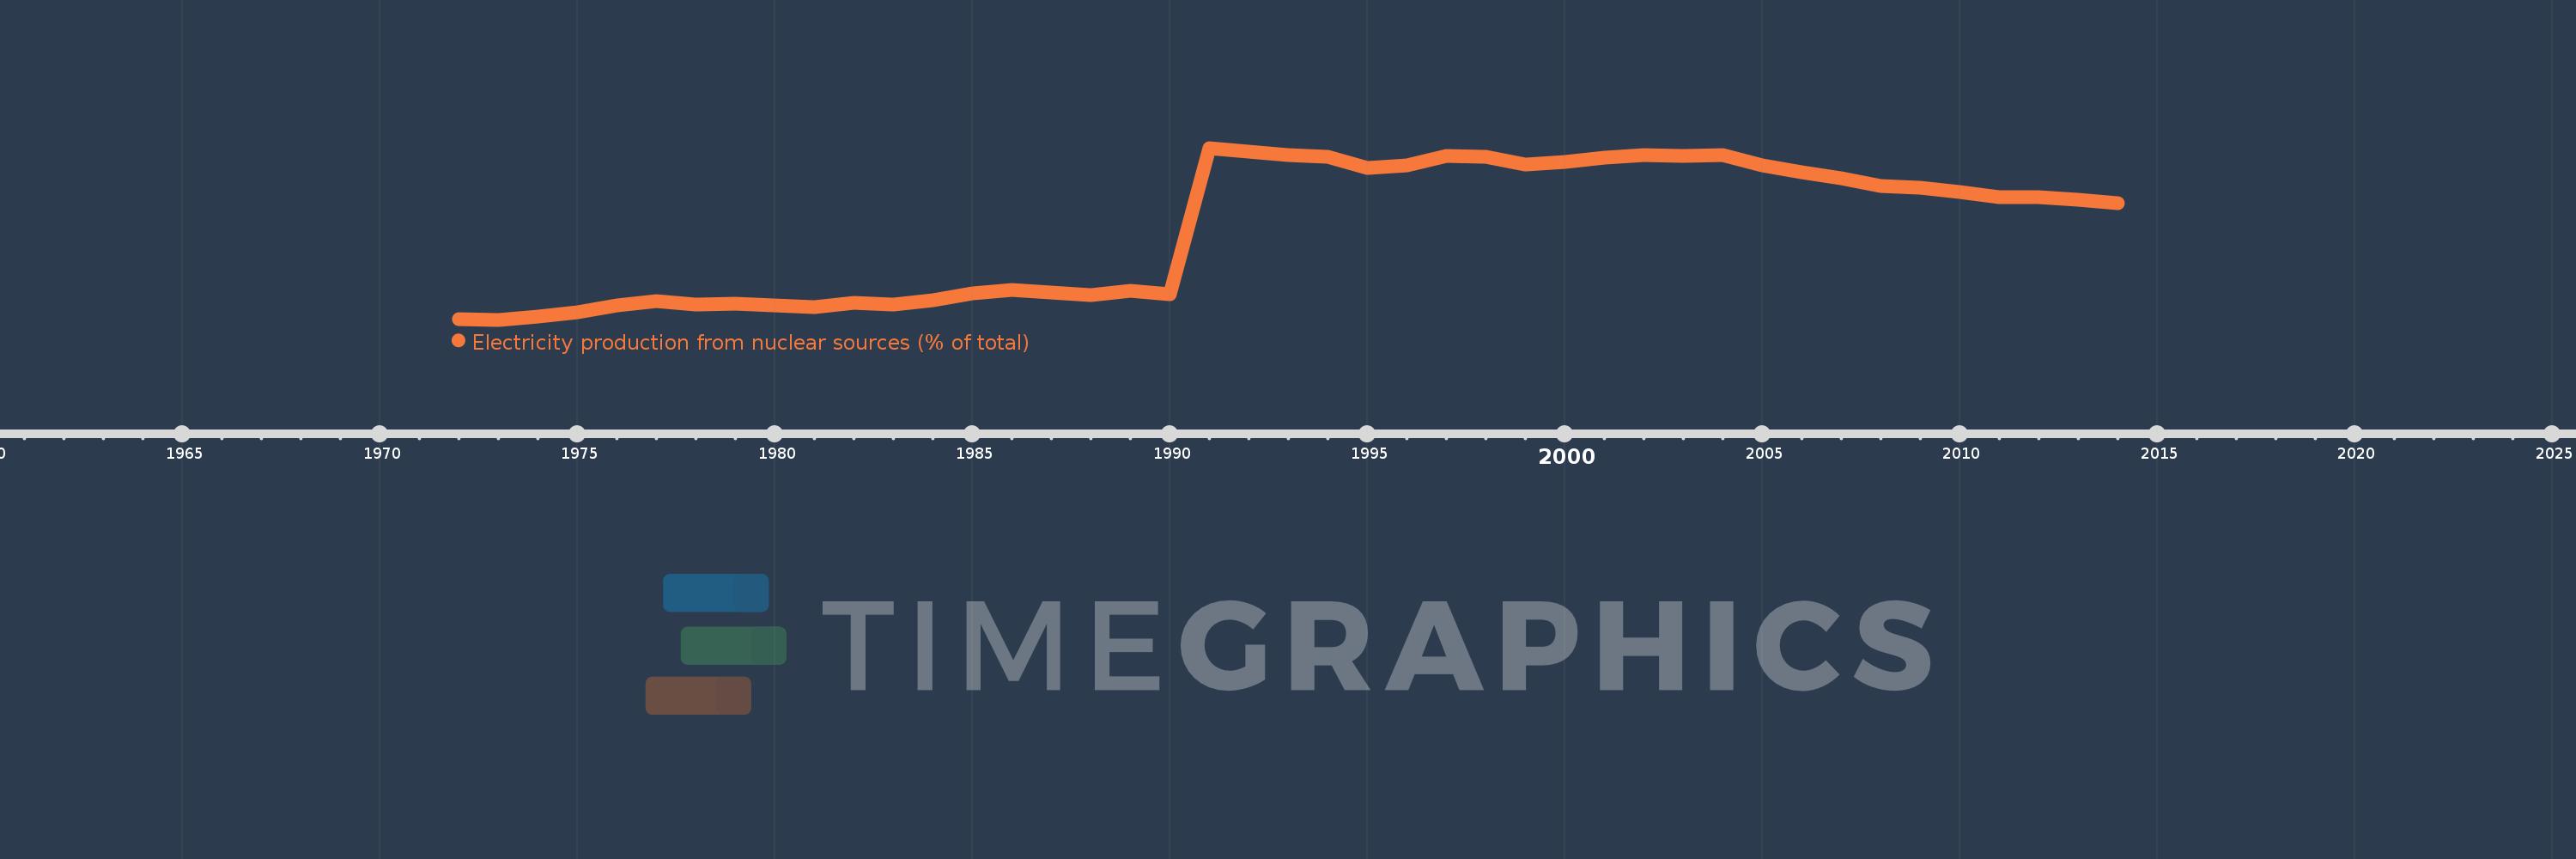
Electricity production from nuclear sources (% of total)
2014,2013,2012,2011,2010,2009,2008,2007,2006,2005,2004,2003,2002,2001,2000,1999,1998,1997,1996,1995,1994,1993,1992,1991,1990,1989,1988,1987,1986,1985,1984,1983,1982,1981,1980,1979,1978,1977,1976,1975,1974,1973,1972
This statistics in other country:
AlbaniaAlgeriaAngolaArab WorldArgentinaArmeniaAustraliaAustriaAzerbaijanBahrainBangladeshBelarusBelgiumBeninBoliviaBosnia and HerzegovinaBotswanaBrazilBrunei DarussalamBulgariaCambodiaCameroonCanadaCentral Europe and the BalticsChileChinaColombiaCongo, Dem. Rep.Congo, Rep.Costa RicaCote d'IvoireCroatiaCubaCuracaoCyprusCzech RepublicDenmarkDominican RepublicEarly-demographic dividendEast Asia & PacificEast Asia & Pacific (excluding high income)East Asia & Pacific (IDA & IBRD countries)EcuadorEgypt, Arab Rep.El SalvadorEritreaEstoniaEthiopiaEuro areaEurope & Central AsiaEurope & Central Asia (excluding high income)Europe & Central Asia (IDA & IBRD countries)European UnionFinlandFragile and conflict affected situationsFranceGabonGeorgiaGermanyGhanaGibraltarGreeceGuatemalaHaitiHeavily indebted poor countries (HIPC)High incomeHondurasHong Kong SAR, ChinaHungaryIBRD onlyIcelandIDA & IBRD totalIDA blendIDA onlyIDA totalIndiaIndonesiaIran, Islamic Rep.IraqIrelandIsraelItalyJamaicaJapanJordanKazakhstanKenyaKorea, Dem. People’s Rep.Korea, Rep.KosovoKuwaitKyrgyz RepublicLate-demographic dividendLatin America & Caribbean Latin America & Caribbean (excluding high income)Latin America & the Caribbean (IDA & IBRD countries)LatviaLeast developed countries: UN classificationLebanonLibyaLithuaniaLow & middle incomeLower middle incomeLuxembourgMacedonia, FYRMalaysiaMaltaMauritiusMexicoMiddle East & North AfricaMiddle East & North Africa (excluding high income)Middle East & North Africa (IDA & IBRD countries)Middle incomeMoldovaMongoliaMontenegroMoroccoMozambiqueMyanmarNamibiaNepalNetherlandsNew ZealandNicaraguaNigerNigeriaNorth AmericaNorwayOECD membersOmanOther small statesPakistanPanamaParaguayPeruPhilippinesPolandPortugalPost-demographic dividendPre-demographic dividendQatarRomaniaRussian FederationSaudi ArabiaSenegalSerbiaSingaporeSlovak RepublicSloveniaSmall statesSouth AfricaSouth AsiaSouth Asia (IDA & IBRD)South SudanSpainSri LankaSub-Saharan Africa Sub-Saharan Africa (excluding high income)Sub-Saharan Africa (IDA & IBRD countries)SudanSwedenSwitzerlandSyrian Arab RepublicTajikistanTanzaniaThailandTogoTrinidad and TobagoTunisiaTurkeyTurkmenistanUkraineUnited Arab EmiratesUnited KingdomUnited StatesUpper middle incomeUruguayUzbekistanVenezuela, RBVietnamWorldYemen, Rep.ZambiaZimbabwe Timeline:
This timeline shows a graph from 1972 to 2014 of Middle income. No data until 1971. Number of actual observations by date: 43.
Source name:
World Development Indicators
Source organization:
IEA Statistics © OECD/IEA 2014 (http://www.iea.org/stats/index.asp), subject to https://www.iea.org/t&c/termsandconditions/
Categories, topics:
Energy & Mining, Climate Change, Infrastructure
Last updated:
apr 23, 2017
Indicators value changes by year
At the date of observation
Value
Absolute change
Change from previous value
jan 1, 1972
0.131
+0.131
0.0%
jan 1, 1973
0.114
-0.017
-12.84%
jan 1, 1974
0.228
+0.114
100.05%
jan 1, 1975
0.368
+0.14
61.35%
jan 1, 1976
0.594
+0.227
61.72%
jan 1, 1977
0.756
+0.161
27.14%
jan 1, 1978
0.625
-0.131
-17.35%
jan 1, 1979
0.658
+0.033
5.31%
jan 1, 1980
0.606
-0.051
-7.83%
jan 1, 1981
0.547
-0.06
-9.86%
jan 1, 1982
0.677
+0.131
23.9%
jan 1, 1983
0.624
-0.053
-7.79%
jan 1, 1984
0.773
+0.149
23.84%
jan 1, 1985
1.001
+0.228
29.43%
jan 1, 1986
1.128
+0.127
12.74%
jan 1, 1987
1.024
-0.104
-9.26%
jan 1, 1988
0.936
-0.087
-8.52%
jan 1, 1989
1.081
+0.144
15.39%
jan 1, 1990
0.983
-0.098
-9.07%
jan 1, 1991
5.929
+4.947
503.47%
jan 1, 1992
5.794
-0.135
-2.27%
jan 1, 1993
5.693
-0.101
-1.75%
jan 1, 1994
5.617
-0.076
-1.34%
jan 1, 1995
5.244
-0.373
-6.63%
jan 1, 1996
5.325
+0.08
1.53%
jan 1, 1997
5.668
+0.343
6.45%
jan 1, 1998
5.644
-0.025
-0.43%
jan 1, 1999
5.371
-0.273
-4.83%
jan 1, 2000
5.459
+0.088
1.65%
jan 1, 2001
5.588
+0.128
2.35%
jan 1, 2002
5.688
+0.101
1.8%
jan 1, 2003
5.652
-0.036
-0.64%
jan 1, 2004
5.68
+0.028
0.49%
jan 1, 2005
5.334
-0.345
-6.08%
jan 1, 2006
5.097
-0.237
-4.45%
jan 1, 2007
4.895
-0.202
-3.97%
jan 1, 2008
4.641
-0.254
-5.19%
jan 1, 2009
4.571
-0.069
-1.5%
jan 1, 2010
4.424
-0.147
-3.21%
jan 1, 2011
4.27
-0.155
-3.49%
jan 1, 2012
4.255
-0.015
-0.36%
jan 1, 2013
4.19
-0.065
-1.52%
jan 1, 2014
4.054
-0.136
-3.25%
Ranking of countries by current statistics by years


Comments: