29
/
en
AIzaSyAYiBZKx7MnpbEhh9jyipgxe19OcubqV5w
April 1, 2024
245463
South Africa
ZAF
true
2
1
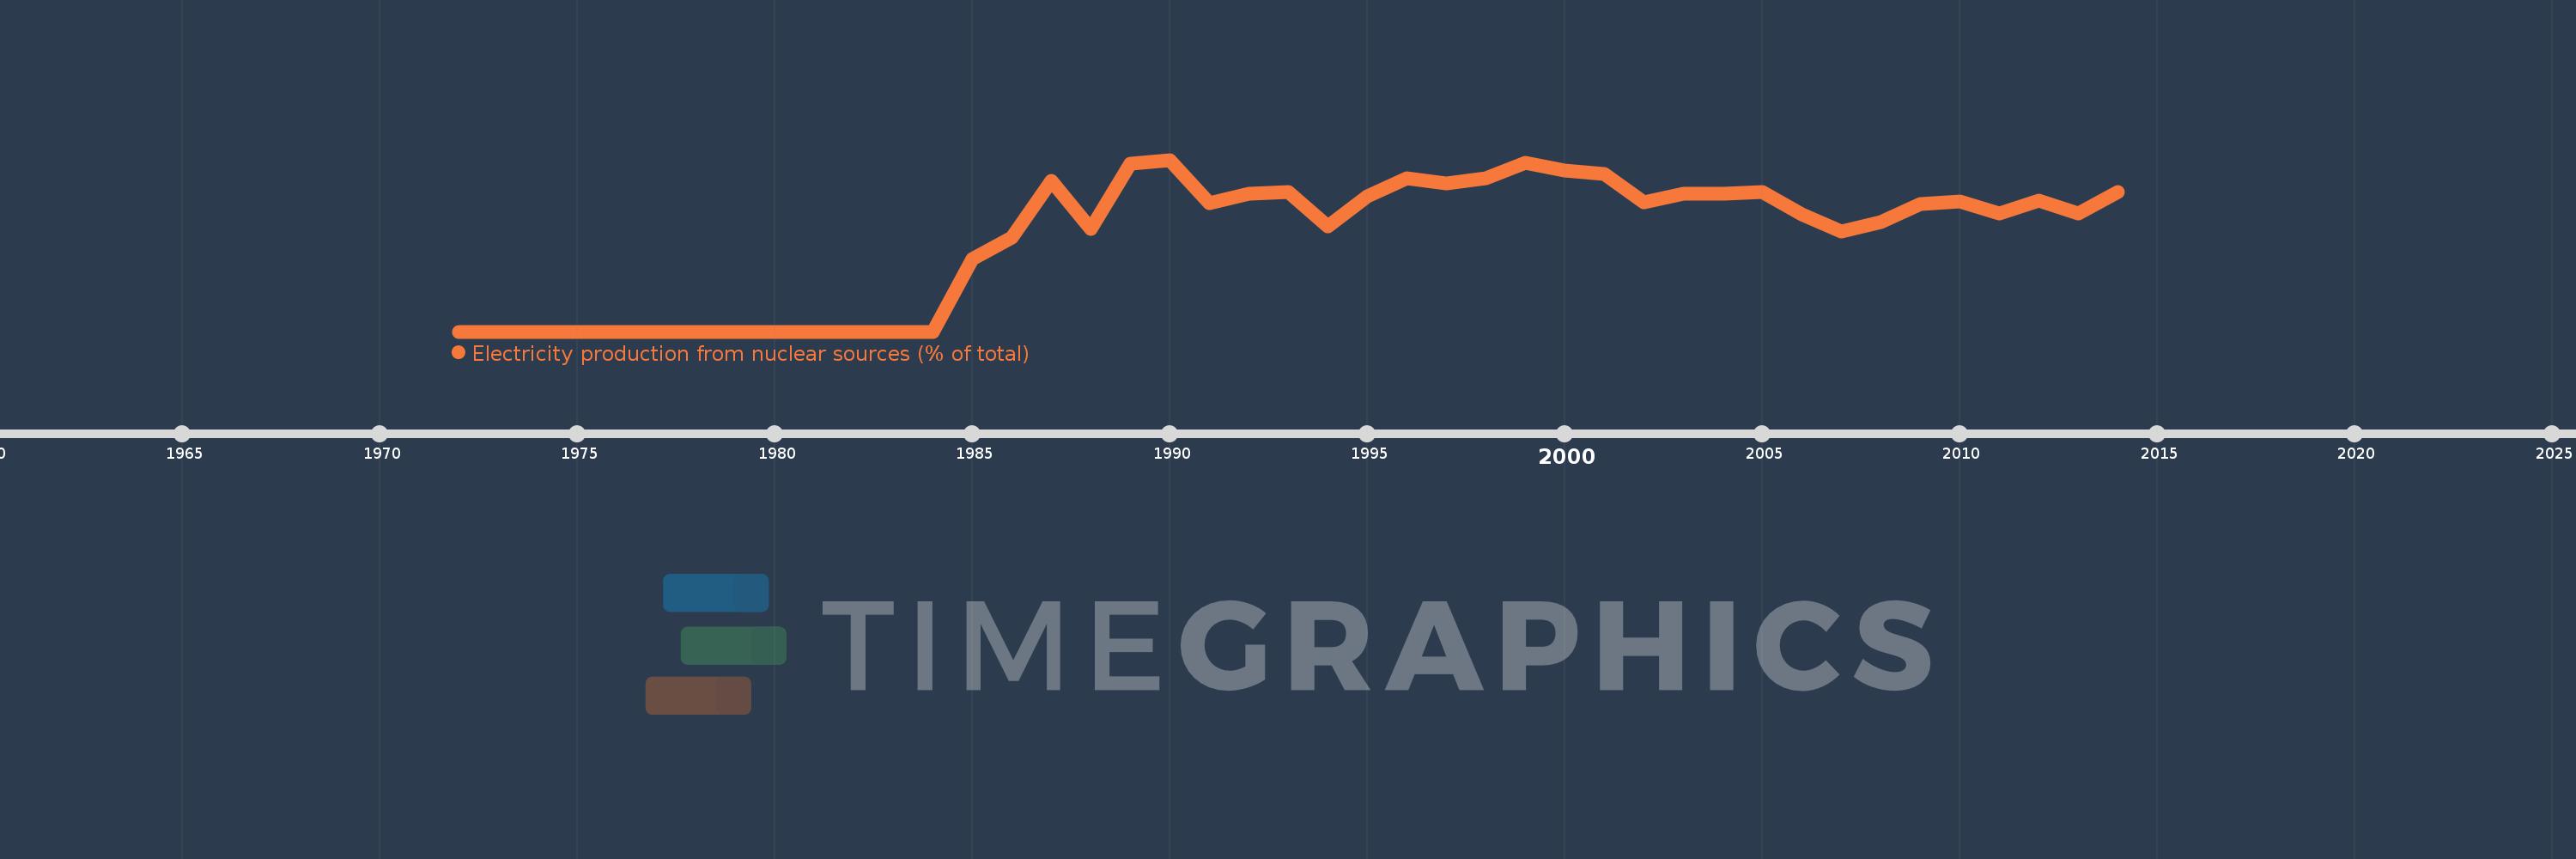
Electricity production from nuclear sources (% of total)
2014,2013,2012,2011,2010,2009,2008,2007,2006,2005,2004,2003,2002,2001,2000,1999,1998,1997,1996,1995,1994,1993,1992,1991,1990,1989,1988,1987,1986,1985,1984,1983,1982,1981,1980,1979,1978,1977,1976,1975,1974,1973,1972
This statistics in other country:
AlbaniaAlgeriaAngolaArab WorldArgentinaArmeniaAustraliaAustriaAzerbaijanBahrainBangladeshBelarusBelgiumBeninBoliviaBosnia and HerzegovinaBotswanaBrazilBrunei DarussalamBulgariaCambodiaCameroonCanadaCentral Europe and the BalticsChileChinaColombiaCongo, Dem. Rep.Congo, Rep.Costa RicaCote d'IvoireCroatiaCubaCuracaoCyprusCzech RepublicDenmarkDominican RepublicEarly-demographic dividendEast Asia & PacificEast Asia & Pacific (excluding high income)East Asia & Pacific (IDA & IBRD countries)EcuadorEgypt, Arab Rep.El SalvadorEritreaEstoniaEthiopiaEuro areaEurope & Central AsiaEurope & Central Asia (excluding high income)Europe & Central Asia (IDA & IBRD countries)European UnionFinlandFragile and conflict affected situationsFranceGabonGeorgiaGermanyGhanaGibraltarGreeceGuatemalaHaitiHeavily indebted poor countries (HIPC)High incomeHondurasHong Kong SAR, ChinaHungaryIBRD onlyIcelandIDA & IBRD totalIDA blendIDA onlyIDA totalIndiaIndonesiaIran, Islamic Rep.IraqIrelandIsraelItalyJamaicaJapanJordanKazakhstanKenyaKorea, Dem. People’s Rep.Korea, Rep.KosovoKuwaitKyrgyz RepublicLate-demographic dividendLatin America & Caribbean Latin America & Caribbean (excluding high income)Latin America & the Caribbean (IDA & IBRD countries)LatviaLeast developed countries: UN classificationLebanonLibyaLithuaniaLow & middle incomeLower middle incomeLuxembourgMacedonia, FYRMalaysiaMaltaMauritiusMexicoMiddle East & North AfricaMiddle East & North Africa (excluding high income)Middle East & North Africa (IDA & IBRD countries)Middle incomeMoldovaMongoliaMontenegroMoroccoMozambiqueMyanmarNamibiaNepalNetherlandsNew ZealandNicaraguaNigerNigeriaNorth AmericaNorwayOECD membersOmanOther small statesPakistanPanamaParaguayPeruPhilippinesPolandPortugalPost-demographic dividendPre-demographic dividendQatarRomaniaRussian FederationSaudi ArabiaSenegalSerbiaSingaporeSlovak RepublicSloveniaSmall statesSouth AfricaSouth AsiaSouth Asia (IDA & IBRD)South SudanSpainSri LankaSub-Saharan Africa Sub-Saharan Africa (excluding high income)Sub-Saharan Africa (IDA & IBRD countries)SudanSwedenSwitzerlandSyrian Arab RepublicTajikistanTanzaniaThailandTogoTrinidad and TobagoTunisiaTurkeyTurkmenistanUkraineUnited Arab EmiratesUnited KingdomUnited StatesUpper middle incomeUruguayUzbekistanVenezuela, RBVietnamWorldYemen, Rep.ZambiaZimbabwe Timeline:
This timeline shows a graph from 1972 to 2014 of South Africa. No data until 1971. Number of actual observations by date: 43.
Source name:
World Development Indicators
Source organization:
IEA Statistics © OECD/IEA 2014 (http://www.iea.org/stats/index.asp), subject to https://www.iea.org/t&c/termsandconditions/
Categories, topics:
Energy & Mining, Climate Change, Infrastructure
Last updated:
apr 23, 2017
Indicators value changes by year
At the date of observation
Value
Absolute change
Change from previous value
jan 1, 1985
2.902
+2.902
%
jan 1, 1986
3.759
+0.857
29.55%
jan 1, 1987
6.011
+2.251
59.89%
jan 1, 1988
4.095
-1.916
-31.87%
jan 1, 1989
6.695
+2.6
63.48%
jan 1, 1990
6.838
+0.143
2.14%
jan 1, 1991
5.109
-1.729
-25.29%
jan 1, 1992
5.491
+0.383
7.49%
jan 1, 1993
5.57
+0.078
1.43%
jan 1, 1994
4.185
-1.385
-24.86%
jan 1, 1995
5.382
+1.197
28.61%
jan 1, 1996
6.096
+0.714
13.27%
jan 1, 1997
5.902
-0.194
-3.18%
jan 1, 1998
6.087
+0.185
3.14%
jan 1, 1999
6.702
+0.614
10.09%
jan 1, 2000
6.405
-0.297
-4.42%
jan 1, 2001
6.26
-0.145
-2.27%
jan 1, 2002
5.149
-1.111
-17.74%
jan 1, 2003
5.486
+0.337
6.55%
jan 1, 2004
5.476
-0.01
-0.19%
jan 1, 2005
5.547
+0.071
1.3%
jan 1, 2006
4.665
-0.882
-15.9%
jan 1, 2007
3.997
-0.669
-14.33%
jan 1, 2008
4.344
+0.348
8.7%
jan 1, 2009
5.089
+0.745
17.15%
jan 1, 2010
5.189
+0.099
1.95%
jan 1, 2011
4.714
-0.474
-9.14%
jan 1, 2012
5.202
+0.487
10.34%
jan 1, 2013
4.689
-0.512
-9.85%
jan 1, 2014
5.571
+0.882
18.8%
Ranking of countries by current statistics by years


Comments: