29
/
en
AIzaSyAYiBZKx7MnpbEhh9jyipgxe19OcubqV5w
April 1, 2024
38072
IDA blend
IDB
false
2
1
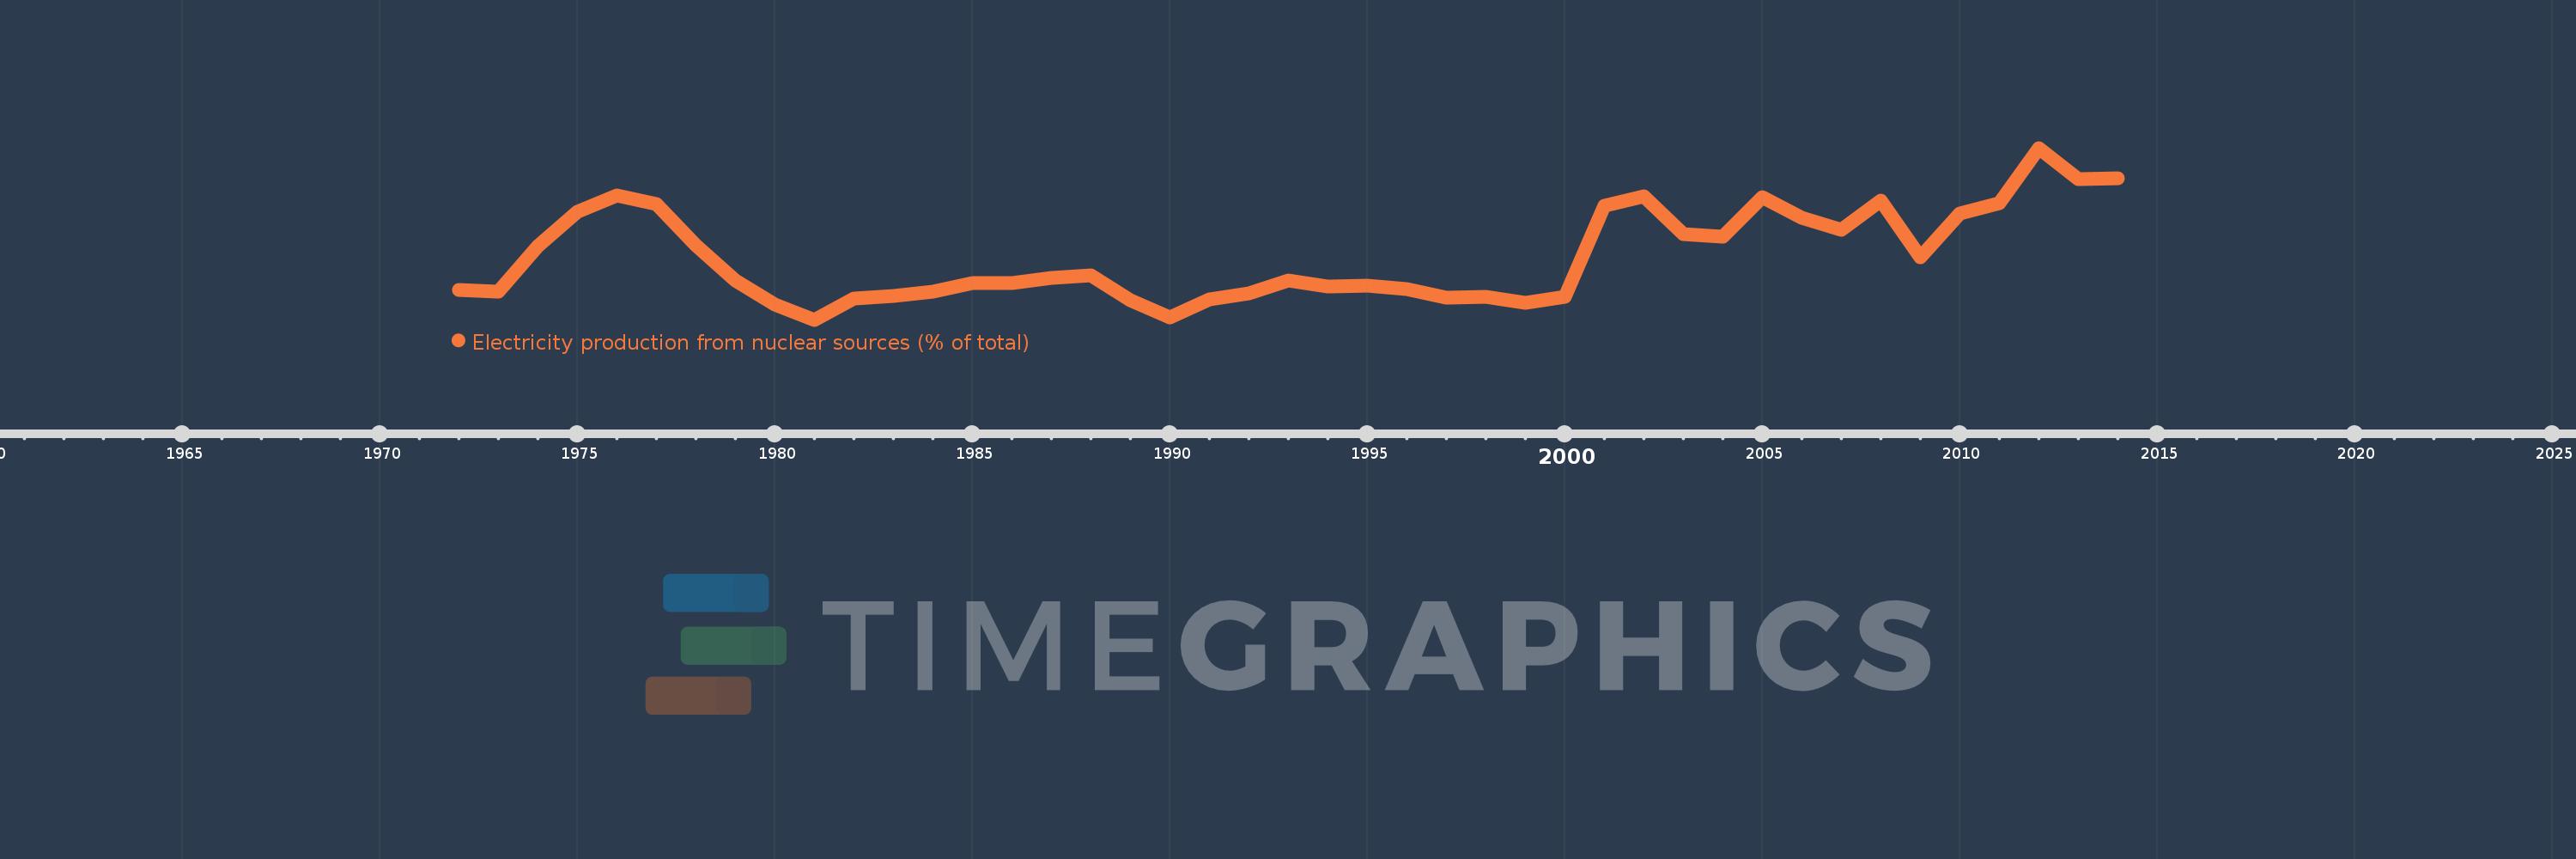
Electricity production from nuclear sources (% of total)
2014,2013,2012,2011,2010,2009,2008,2007,2006,2005,2004,2003,2002,2001,2000,1999,1998,1997,1996,1995,1994,1993,1992,1991,1990,1989,1988,1987,1986,1985,1984,1983,1982,1981,1980,1979,1978,1977,1976,1975,1974,1973,1972
This statistics in other country:
AlbaniaAlgeriaAngolaArab WorldArgentinaArmeniaAustraliaAustriaAzerbaijanBahrainBangladeshBelarusBelgiumBeninBoliviaBosnia and HerzegovinaBotswanaBrazilBrunei DarussalamBulgariaCambodiaCameroonCanadaCentral Europe and the BalticsChileChinaColombiaCongo, Dem. Rep.Congo, Rep.Costa RicaCote d'IvoireCroatiaCubaCuracaoCyprusCzech RepublicDenmarkDominican RepublicEarly-demographic dividendEast Asia & PacificEast Asia & Pacific (excluding high income)East Asia & Pacific (IDA & IBRD countries)EcuadorEgypt, Arab Rep.El SalvadorEritreaEstoniaEthiopiaEuro areaEurope & Central AsiaEurope & Central Asia (excluding high income)Europe & Central Asia (IDA & IBRD countries)European UnionFinlandFragile and conflict affected situationsFranceGabonGeorgiaGermanyGhanaGibraltarGreeceGuatemalaHaitiHeavily indebted poor countries (HIPC)High incomeHondurasHong Kong SAR, ChinaHungaryIBRD onlyIcelandIDA & IBRD totalIDA blendIDA onlyIDA totalIndiaIndonesiaIran, Islamic Rep.IraqIrelandIsraelItalyJamaicaJapanJordanKazakhstanKenyaKorea, Dem. People’s Rep.Korea, Rep.KosovoKuwaitKyrgyz RepublicLate-demographic dividendLatin America & Caribbean Latin America & Caribbean (excluding high income)Latin America & the Caribbean (IDA & IBRD countries)LatviaLeast developed countries: UN classificationLebanonLibyaLithuaniaLow & middle incomeLower middle incomeLuxembourgMacedonia, FYRMalaysiaMaltaMauritiusMexicoMiddle East & North AfricaMiddle East & North Africa (excluding high income)Middle East & North Africa (IDA & IBRD countries)Middle incomeMoldovaMongoliaMontenegroMoroccoMozambiqueMyanmarNamibiaNepalNetherlandsNew ZealandNicaraguaNigerNigeriaNorth AmericaNorwayOECD membersOmanOther small statesPakistanPanamaParaguayPeruPhilippinesPolandPortugalPost-demographic dividendPre-demographic dividendQatarRomaniaRussian FederationSaudi ArabiaSenegalSerbiaSingaporeSlovak RepublicSloveniaSmall statesSouth AfricaSouth AsiaSouth Asia (IDA & IBRD)South SudanSpainSri LankaSub-Saharan Africa Sub-Saharan Africa (excluding high income)Sub-Saharan Africa (IDA & IBRD countries)SudanSwedenSwitzerlandSyrian Arab RepublicTajikistanTanzaniaThailandTogoTrinidad and TobagoTunisiaTurkeyTurkmenistanUkraineUnited Arab EmiratesUnited KingdomUnited StatesUpper middle incomeUruguayUzbekistanVenezuela, RBVietnamWorldYemen, Rep.ZambiaZimbabwe Timeline:
This timeline shows a graph from 1972 to 2014 of IDA blend. No data until 1971. Number of actual observations by date: 43.
Source name:
World Development Indicators
Source organization:
IEA Statistics © OECD/IEA 2014 (http://www.iea.org/stats/index.asp), subject to https://www.iea.org/t&c/termsandconditions/
Categories, topics:
Energy & Mining, Climate Change, Infrastructure
Last updated:
apr 23, 2017
Indicators value changes by year
At the date of observation
Value
Absolute change
Change from previous value
jan 1, 1972
0.275
+0.275
0.0%
jan 1, 1973
0.258
-0.017
-6.2%
jan 1, 1974
0.676
+0.418
162.26%
jan 1, 1975
0.993
+0.317
46.82%
jan 1, 1976
1.141
+0.148
14.93%
jan 1, 1977
1.065
-0.076
-6.67%
jan 1, 1978
0.689
-0.376
-35.34%
jan 1, 1979
0.36
-0.329
-47.73%
jan 1, 1980
0.145
-0.215
-59.65%
jan 1, 1981
0.003
-0.142
-98.09%
jan 1, 1982
0.195
+0.192
6.92K%
jan 1, 1983
0.221
+0.027
13.61%
jan 1, 1984
0.26
+0.038
17.31%
jan 1, 1985
0.342
+0.082
31.48%
jan 1, 1986
0.337
-0.004
-1.24%
jan 1, 1987
0.386
+0.048
14.33%
jan 1, 1988
0.411
+0.025
6.46%
jan 1, 1989
0.185
-0.226
-54.98%
jan 1, 1990
0.021
-0.164
-88.9%
jan 1, 1991
0.186
+0.166
806.98%
jan 1, 1992
0.243
+0.057
30.6%
jan 1, 1993
0.361
+0.118
48.45%
jan 1, 1994
0.31
-0.051
-14.03%
jan 1, 1995
0.314
+0.003
1.06%
jan 1, 1996
0.288
-0.026
-8.23%
jan 1, 1997
0.203
-0.084
-29.32%
jan 1, 1998
0.213
+0.009
4.65%
jan 1, 1999
0.157
-0.056
-26.27%
jan 1, 2000
0.216
+0.059
37.7%
jan 1, 2001
1.046
+0.83
384.01%
jan 1, 2002
1.133
+0.087
8.29%
jan 1, 2003
0.791
-0.342
-30.15%
jan 1, 2004
0.763
-0.028
-3.59%
jan 1, 2005
1.127
+0.364
47.76%
jan 1, 2006
0.942
-0.185
-16.39%
jan 1, 2007
0.825
-0.117
-12.4%
jan 1, 2008
1.1
+0.275
33.31%
jan 1, 2009
0.574
-0.526
-47.81%
jan 1, 2010
0.981
+0.406
70.74%
jan 1, 2011
1.076
+0.095
9.72%
jan 1, 2012
1.58
+0.504
46.85%
jan 1, 2013
1.291
-0.288
-18.26%
jan 1, 2014
1.305
+0.014
1.07%
Ranking of countries by current statistics by years


Comments: