29
/
en
AIzaSyAYiBZKx7MnpbEhh9jyipgxe19OcubqV5w
April 1, 2024
100988
Canada
CAN
true
2
1
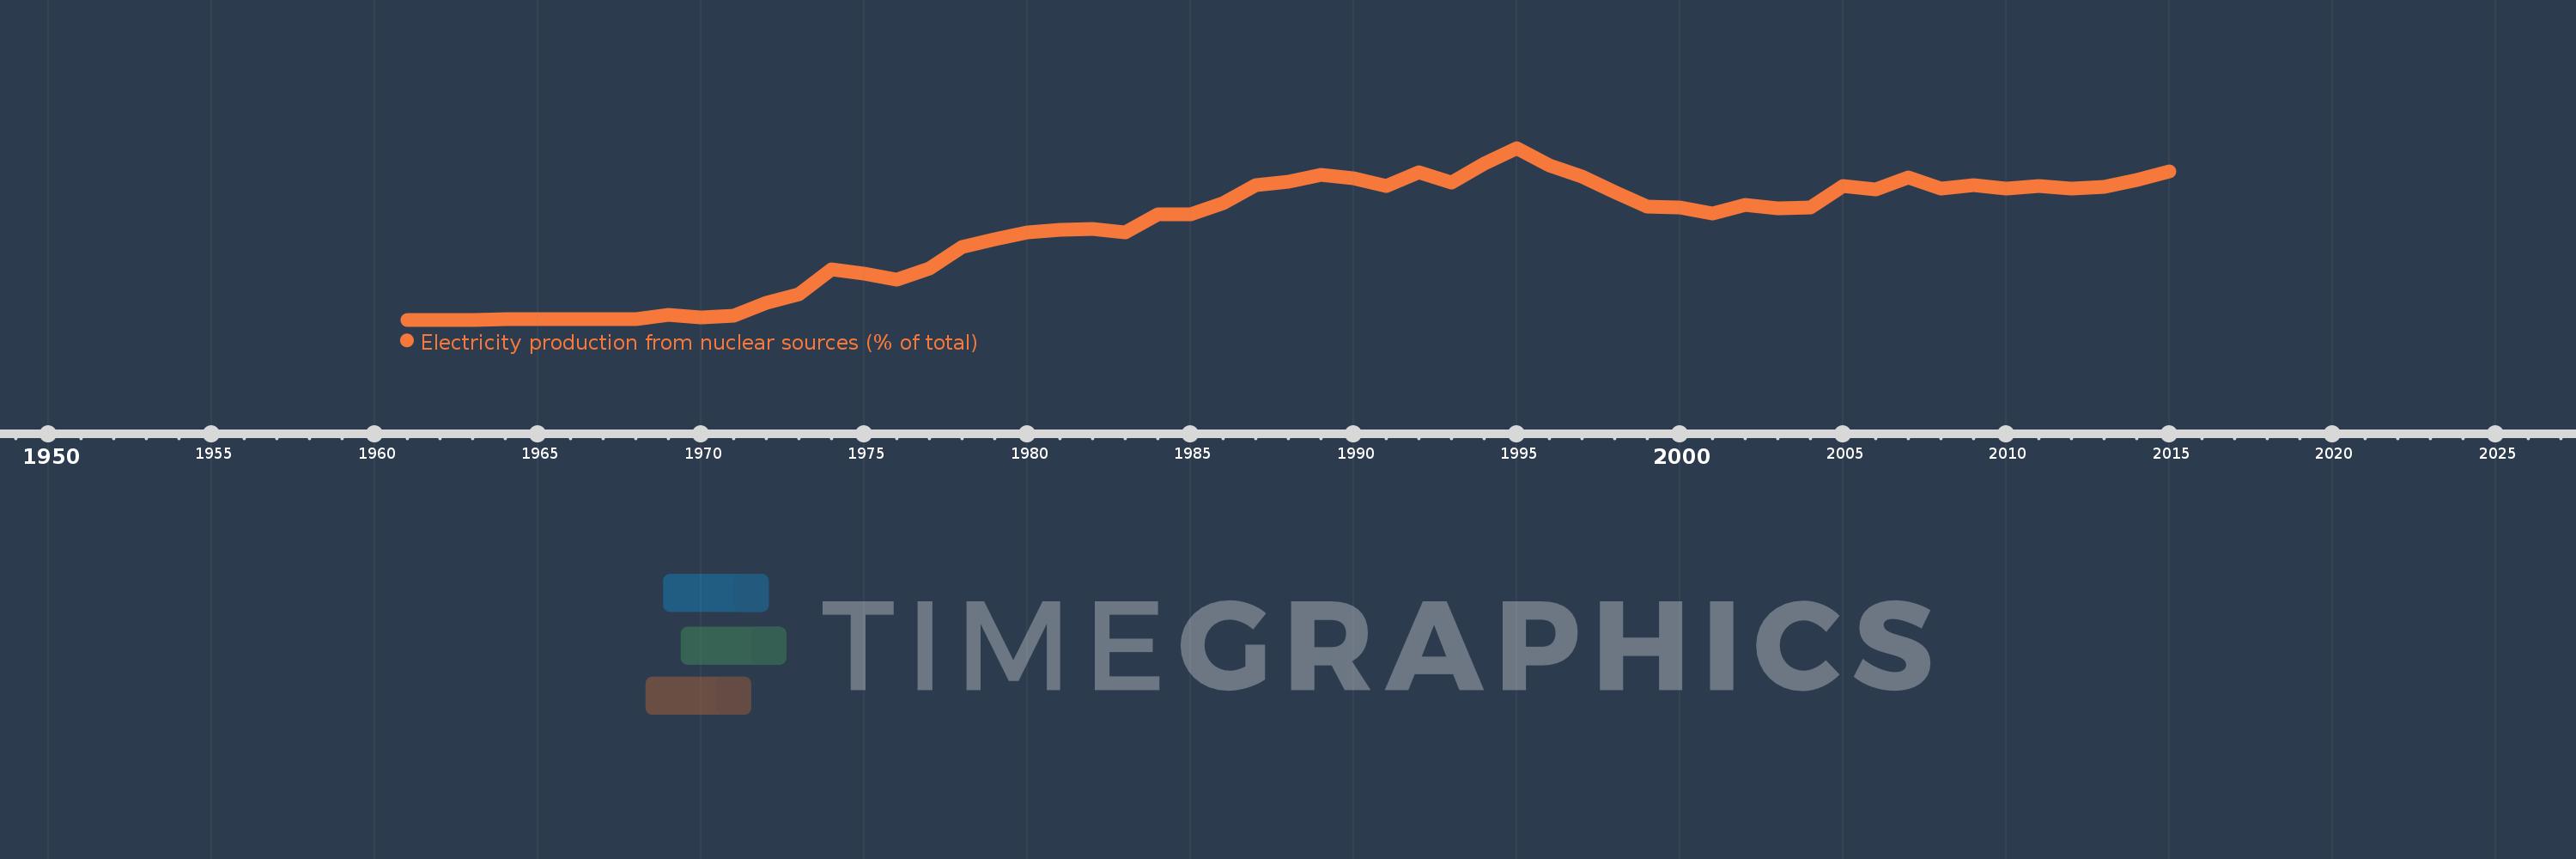
Electricity production from nuclear sources (% of total)
2015,2014,2013,2012,2011,2010,2009,2008,2007,2006,2005,2004,2003,2002,2001,2000,1999,1998,1997,1996,1995,1994,1993,1992,1991,1990,1989,1988,1987,1986,1985,1984,1983,1982,1981,1980,1979,1978,1977,1976,1975,1974,1973,1972,1971,1970,1969,1968,1967,1966,1965,1964,1963,1962,1961
This statistics in other country:
AlbaniaAlgeriaAngolaArab WorldArgentinaArmeniaAustraliaAustriaAzerbaijanBahrainBangladeshBelarusBelgiumBeninBoliviaBosnia and HerzegovinaBotswanaBrazilBrunei DarussalamBulgariaCambodiaCameroonCanadaCentral Europe and the BalticsChileChinaColombiaCongo, Dem. Rep.Congo, Rep.Costa RicaCote d'IvoireCroatiaCubaCuracaoCyprusCzech RepublicDenmarkDominican RepublicEarly-demographic dividendEast Asia & PacificEast Asia & Pacific (excluding high income)East Asia & Pacific (IDA & IBRD countries)EcuadorEgypt, Arab Rep.El SalvadorEritreaEstoniaEthiopiaEuro areaEurope & Central AsiaEurope & Central Asia (excluding high income)Europe & Central Asia (IDA & IBRD countries)European UnionFinlandFragile and conflict affected situationsFranceGabonGeorgiaGermanyGhanaGibraltarGreeceGuatemalaHaitiHeavily indebted poor countries (HIPC)High incomeHondurasHong Kong SAR, ChinaHungaryIBRD onlyIcelandIDA & IBRD totalIDA blendIDA onlyIDA totalIndiaIndonesiaIran, Islamic Rep.IraqIrelandIsraelItalyJamaicaJapanJordanKazakhstanKenyaKorea, Dem. People’s Rep.Korea, Rep.KosovoKuwaitKyrgyz RepublicLate-demographic dividendLatin America & Caribbean Latin America & Caribbean (excluding high income)Latin America & the Caribbean (IDA & IBRD countries)LatviaLeast developed countries: UN classificationLebanonLibyaLithuaniaLow & middle incomeLower middle incomeLuxembourgMacedonia, FYRMalaysiaMaltaMauritiusMexicoMiddle East & North AfricaMiddle East & North Africa (excluding high income)Middle East & North Africa (IDA & IBRD countries)Middle incomeMoldovaMongoliaMontenegroMoroccoMozambiqueMyanmarNamibiaNepalNetherlandsNew ZealandNicaraguaNigerNigeriaNorth AmericaNorwayOECD membersOmanOther small statesPakistanPanamaParaguayPeruPhilippinesPolandPortugalPost-demographic dividendPre-demographic dividendQatarRomaniaRussian FederationSaudi ArabiaSenegalSerbiaSingaporeSlovak RepublicSloveniaSmall statesSouth AfricaSouth AsiaSouth Asia (IDA & IBRD)South SudanSpainSri LankaSub-Saharan Africa Sub-Saharan Africa (excluding high income)Sub-Saharan Africa (IDA & IBRD countries)SudanSwedenSwitzerlandSyrian Arab RepublicTajikistanTanzaniaThailandTogoTrinidad and TobagoTunisiaTurkeyTurkmenistanUkraineUnited Arab EmiratesUnited KingdomUnited StatesUpper middle incomeUruguayUzbekistanVenezuela, RBVietnamWorldYemen, Rep.ZambiaZimbabwe Timeline:
This timeline shows a graph from 1961 to 2015 of Canada. No data until 1960. Number of actual observations by date: 55.
Source name:
World Development Indicators
Source organization:
IEA Statistics © OECD/IEA 2014 (http://www.iea.org/stats/index.asp), subject to https://www.iea.org/t&c/termsandconditions/
Categories, topics:
Energy & Mining, Climate Change, Infrastructure
Last updated:
apr 23, 2017
Indicators value changes by year
Maximum:
19.406
jan 1, 1995
At the date of observation
Value
Absolute change
Change from previous value
jan 1, 1964
0.075
+0.075
%
jan 1, 1965
0.11
+0.035
46.99%
jan 1, 1966
0.087
-0.023
-20.82%
jan 1, 1967
0.107
+0.02
22.64%
jan 1, 1968
0.09
-0.016
-15.16%
jan 1, 1969
0.509
+0.418
462.11%
jan 1, 1970
0.271
-0.238
-46.77%
jan 1, 1971
0.495
+0.224
82.85%
jan 1, 1972
1.924
+1.429
288.62%
jan 1, 1973
2.93
+1.006
52.31%
jan 1, 1974
5.648
+2.718
92.78%
jan 1, 1975
5.183
-0.464
-8.22%
jan 1, 1976
4.537
-0.647
-12.48%
jan 1, 1977
5.84
+1.303
28.73%
jan 1, 1978
8.18
+2.34
40.07%
jan 1, 1979
9.099
+0.919
11.24%
jan 1, 1980
9.822
+0.723
7.94%
jan 1, 1981
10.189
+0.367
3.74%
jan 1, 1982
10.261
+0.073
0.71%
jan 1, 1983
9.897
-0.364
-3.55%
jan 1, 1984
11.919
+2.022
20.43%
jan 1, 1985
11.947
+0.028
0.23%
jan 1, 1986
13.188
+1.241
10.39%
jan 1, 1987
15.212
+2.024
15.35%
jan 1, 1988
15.569
+0.357
2.34%
jan 1, 1989
16.382
+0.813
5.22%
jan 1, 1990
15.991
-0.391
-2.39%
jan 1, 1991
15.137
-0.854
-5.34%
jan 1, 1992
16.703
+1.566
10.35%
jan 1, 1993
15.488
-1.215
-7.27%
jan 1, 1994
17.653
+2.165
13.98%
jan 1, 1995
19.406
+1.753
9.93%
jan 1, 1996
17.472
-1.934
-9.97%
jan 1, 1997
16.192
-1.28
-7.33%
jan 1, 1998
14.388
-1.804
-11.14%
jan 1, 1999
12.732
-1.655
-11.51%
jan 1, 2000
12.694
-0.038
-0.3%
jan 1, 2001
12.021
-0.673
-5.3%
jan 1, 2002
13.004
+0.983
8.18%
jan 1, 2003
12.563
-0.441
-3.39%
jan 1, 2004
12.703
+0.14
1.11%
jan 1, 2005
15.068
+2.364
18.61%
jan 1, 2006
14.726
-0.342
-2.27%
jan 1, 2007
16.046
+1.321
8.97%
jan 1, 2008
14.854
-1.192
-7.43%
jan 1, 2009
15.193
+0.339
2.28%
jan 1, 2010
14.791
-0.402
-2.65%
jan 1, 2011
15.136
+0.345
2.33%
jan 1, 2012
14.786
-0.35
-2.31%
jan 1, 2013
14.984
+0.198
1.34%
jan 1, 2014
15.77
+0.786
5.24%
jan 1, 2015
16.73
+0.96
6.09%
Ranking of countries by current statistics by years


Comments: