29
/
en
AIzaSyAYiBZKx7MnpbEhh9jyipgxe19OcubqV5w
April 1, 2024
241484
Slovak Republic
SVK
true
2
1
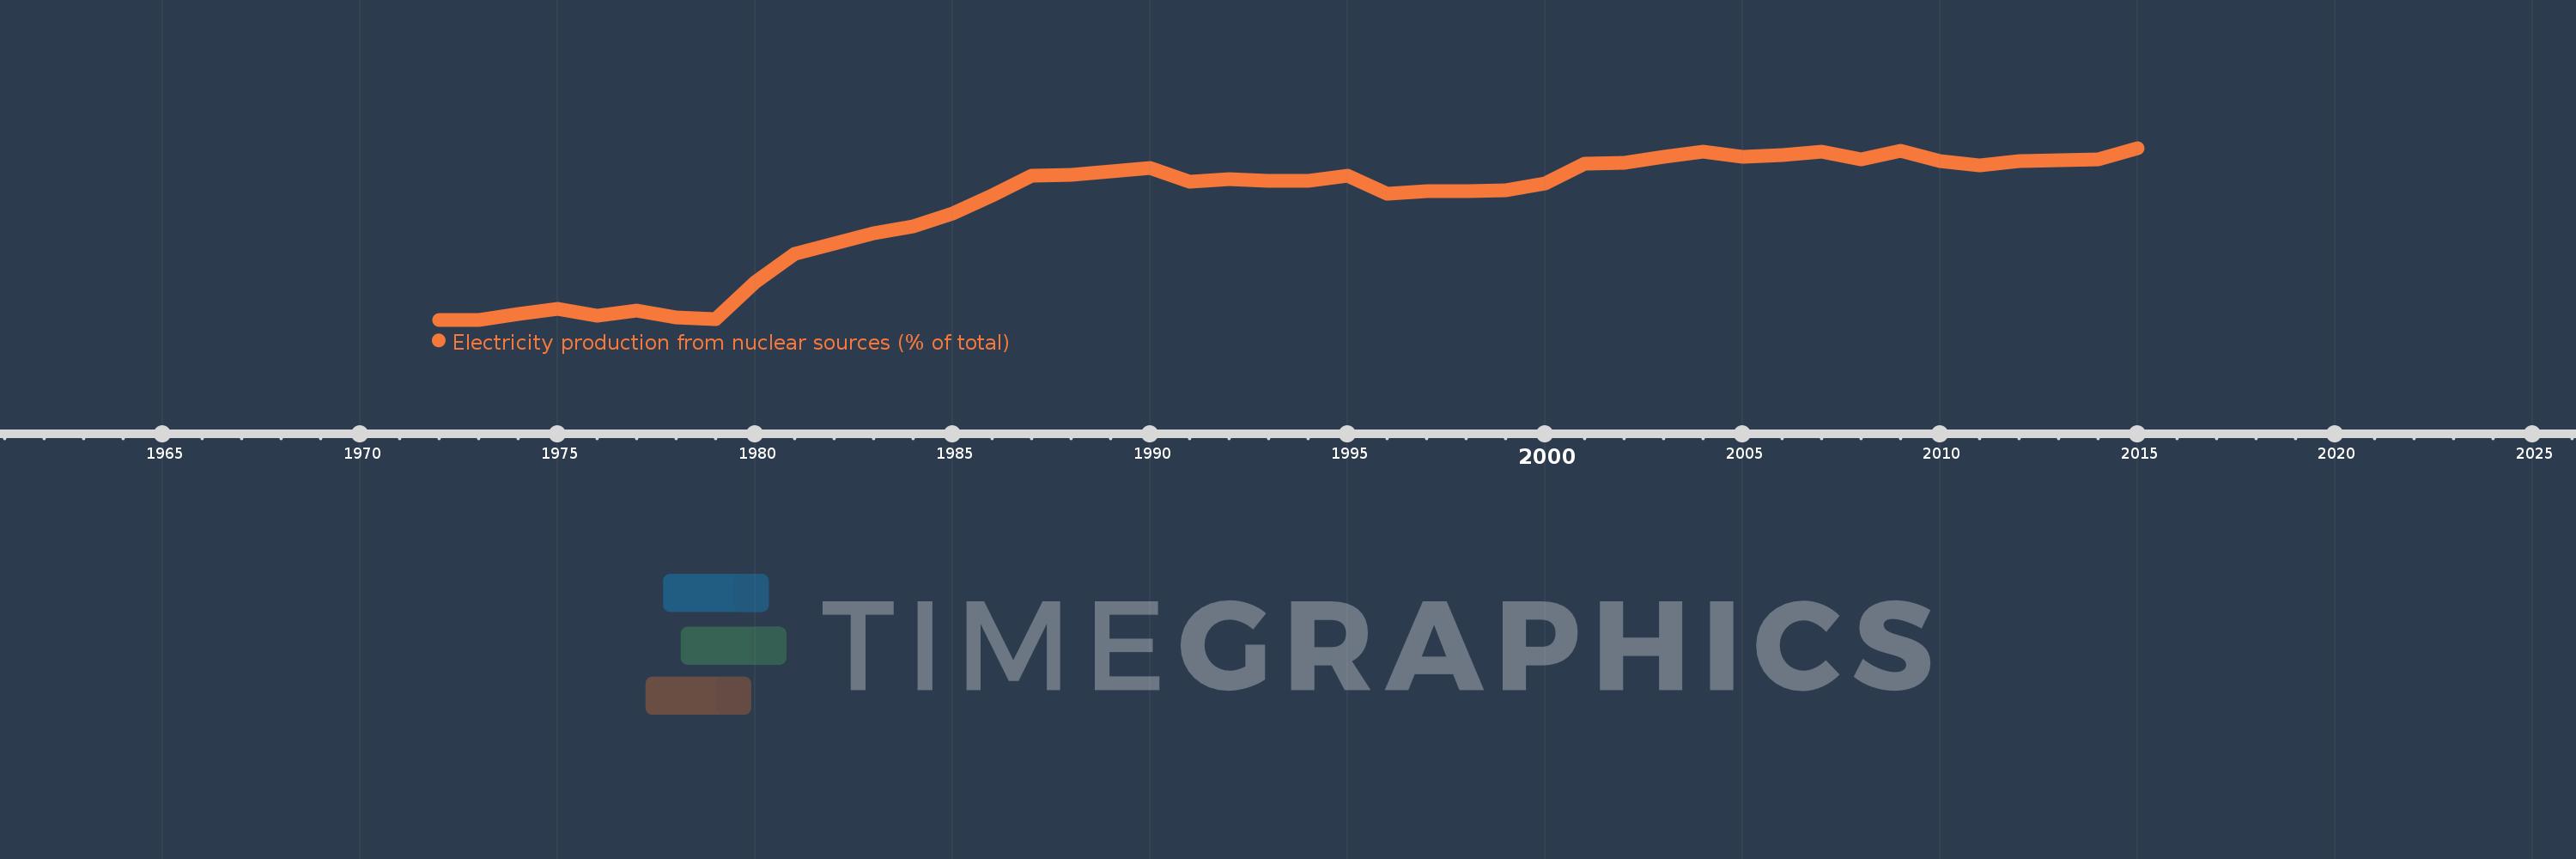
Electricity production from nuclear sources (% of total)
2015,2014,2013,2012,2011,2010,2009,2008,2007,2006,2005,2004,2003,2002,2001,2000,1999,1998,1997,1996,1995,1994,1993,1992,1991,1990,1989,1988,1987,1986,1985,1984,1983,1982,1981,1980,1979,1978,1977,1976,1975,1974,1973,1972
This statistics in other country:
AlbaniaAlgeriaAngolaArab WorldArgentinaArmeniaAustraliaAustriaAzerbaijanBahrainBangladeshBelarusBelgiumBeninBoliviaBosnia and HerzegovinaBotswanaBrazilBrunei DarussalamBulgariaCambodiaCameroonCanadaCentral Europe and the BalticsChileChinaColombiaCongo, Dem. Rep.Congo, Rep.Costa RicaCote d'IvoireCroatiaCubaCuracaoCyprusCzech RepublicDenmarkDominican RepublicEarly-demographic dividendEast Asia & PacificEast Asia & Pacific (excluding high income)East Asia & Pacific (IDA & IBRD countries)EcuadorEgypt, Arab Rep.El SalvadorEritreaEstoniaEthiopiaEuro areaEurope & Central AsiaEurope & Central Asia (excluding high income)Europe & Central Asia (IDA & IBRD countries)European UnionFinlandFragile and conflict affected situationsFranceGabonGeorgiaGermanyGhanaGibraltarGreeceGuatemalaHaitiHeavily indebted poor countries (HIPC)High incomeHondurasHong Kong SAR, ChinaHungaryIBRD onlyIcelandIDA & IBRD totalIDA blendIDA onlyIDA totalIndiaIndonesiaIran, Islamic Rep.IraqIrelandIsraelItalyJamaicaJapanJordanKazakhstanKenyaKorea, Dem. People’s Rep.Korea, Rep.KosovoKuwaitKyrgyz RepublicLate-demographic dividendLatin America & Caribbean Latin America & Caribbean (excluding high income)Latin America & the Caribbean (IDA & IBRD countries)LatviaLeast developed countries: UN classificationLebanonLibyaLithuaniaLow & middle incomeLower middle incomeLuxembourgMacedonia, FYRMalaysiaMaltaMauritiusMexicoMiddle East & North AfricaMiddle East & North Africa (excluding high income)Middle East & North Africa (IDA & IBRD countries)Middle incomeMoldovaMongoliaMontenegroMoroccoMozambiqueMyanmarNamibiaNepalNetherlandsNew ZealandNicaraguaNigerNigeriaNorth AmericaNorwayOECD membersOmanOther small statesPakistanPanamaParaguayPeruPhilippinesPolandPortugalPost-demographic dividendPre-demographic dividendQatarRomaniaRussian FederationSaudi ArabiaSenegalSerbiaSingaporeSlovak RepublicSloveniaSmall statesSouth AfricaSouth AsiaSouth Asia (IDA & IBRD)South SudanSpainSri LankaSub-Saharan Africa Sub-Saharan Africa (excluding high income)Sub-Saharan Africa (IDA & IBRD countries)SudanSwedenSwitzerlandSyrian Arab RepublicTajikistanTanzaniaThailandTogoTrinidad and TobagoTunisiaTurkeyTurkmenistanUkraineUnited Arab EmiratesUnited KingdomUnited StatesUpper middle incomeUruguayUzbekistanVenezuela, RBVietnamWorldYemen, Rep.ZambiaZimbabwe Timeline:
This timeline shows a graph from 1972 to 2015 of Slovak Republic. No data until 1971. Number of actual observations by date: 44.
Source name:
World Development Indicators
Source organization:
IEA Statistics © OECD/IEA 2014 (http://www.iea.org/stats/index.asp), subject to https://www.iea.org/t&c/termsandconditions/
Categories, topics:
Energy & Mining, Climate Change, Infrastructure
Last updated:
apr 23, 2017
Indicators value changes by year
At the date of observation
Value
Absolute change
Change from previous value
jan 1, 1973
0.025
+0.025
%
jan 1, 1974
1.886
+1.861
7.33K%
jan 1, 1975
3.772
+1.885
99.94%
jan 1, 1976
1.399
-2.373
-62.91%
jan 1, 1977
3.045
+1.646
117.67%
jan 1, 1978
0.745
-2.3
-75.54%
jan 1, 1979
0.123
-0.622
-83.47%
jan 1, 1980
12.747
+12.624
10.25K%
jan 1, 1981
22.652
+9.905
77.71%
jan 1, 1982
26.049
+3.397
15.0%
jan 1, 1983
29.57
+3.52
13.51%
jan 1, 1984
31.978
+2.408
8.14%
jan 1, 1985
36.291
+4.313
13.49%
jan 1, 1986
42.752
+6.461
17.8%
jan 1, 1987
49.374
+6.622
15.49%
jan 1, 1988
49.792
+0.418
0.85%
jan 1, 1989
51.014
+1.221
2.45%
jan 1, 1990
51.953
+0.939
1.84%
jan 1, 1991
47.206
-4.747
-9.14%
jan 1, 1992
48.18
+0.975
2.06%
jan 1, 1993
47.564
-0.617
-1.28%
jan 1, 1994
47.771
+0.207
0.44%
jan 1, 1995
49.474
+1.703
3.56%
jan 1, 1996
43.276
-6.198
-12.53%
jan 1, 1997
44.193
+0.917
2.12%
jan 1, 1998
44.198
+0.005
0.01%
jan 1, 1999
44.279
+0.081
0.18%
jan 1, 2000
46.671
+2.392
5.4%
jan 1, 2001
53.555
+6.884
14.75%
jan 1, 2002
53.688
+0.133
0.25%
jan 1, 2003
55.734
+2.045
3.81%
jan 1, 2004
57.652
+1.918
3.44%
jan 1, 2005
55.896
-1.756
-3.05%
jan 1, 2006
56.542
+0.646
1.15%
jan 1, 2007
57.637
+1.095
1.94%
jan 1, 2008
54.976
-2.66
-4.62%
jan 1, 2009
58.077
+3.101
5.64%
jan 1, 2010
54.327
-3.75
-6.46%
jan 1, 2011
53.066
-1.261
-2.32%
jan 1, 2012
54.479
+1.413
2.66%
jan 1, 2013
54.699
+0.22
0.4%
jan 1, 2014
55.131
+0.432
0.79%
jan 1, 2015
58.91
+3.779
6.86%
Ranking of countries by current statistics by years


Comments: