29
/
en
AIzaSyAYiBZKx7MnpbEhh9jyipgxe19OcubqV5w
April 1, 2024
61520
Upper middle income
UMC
false
2
1
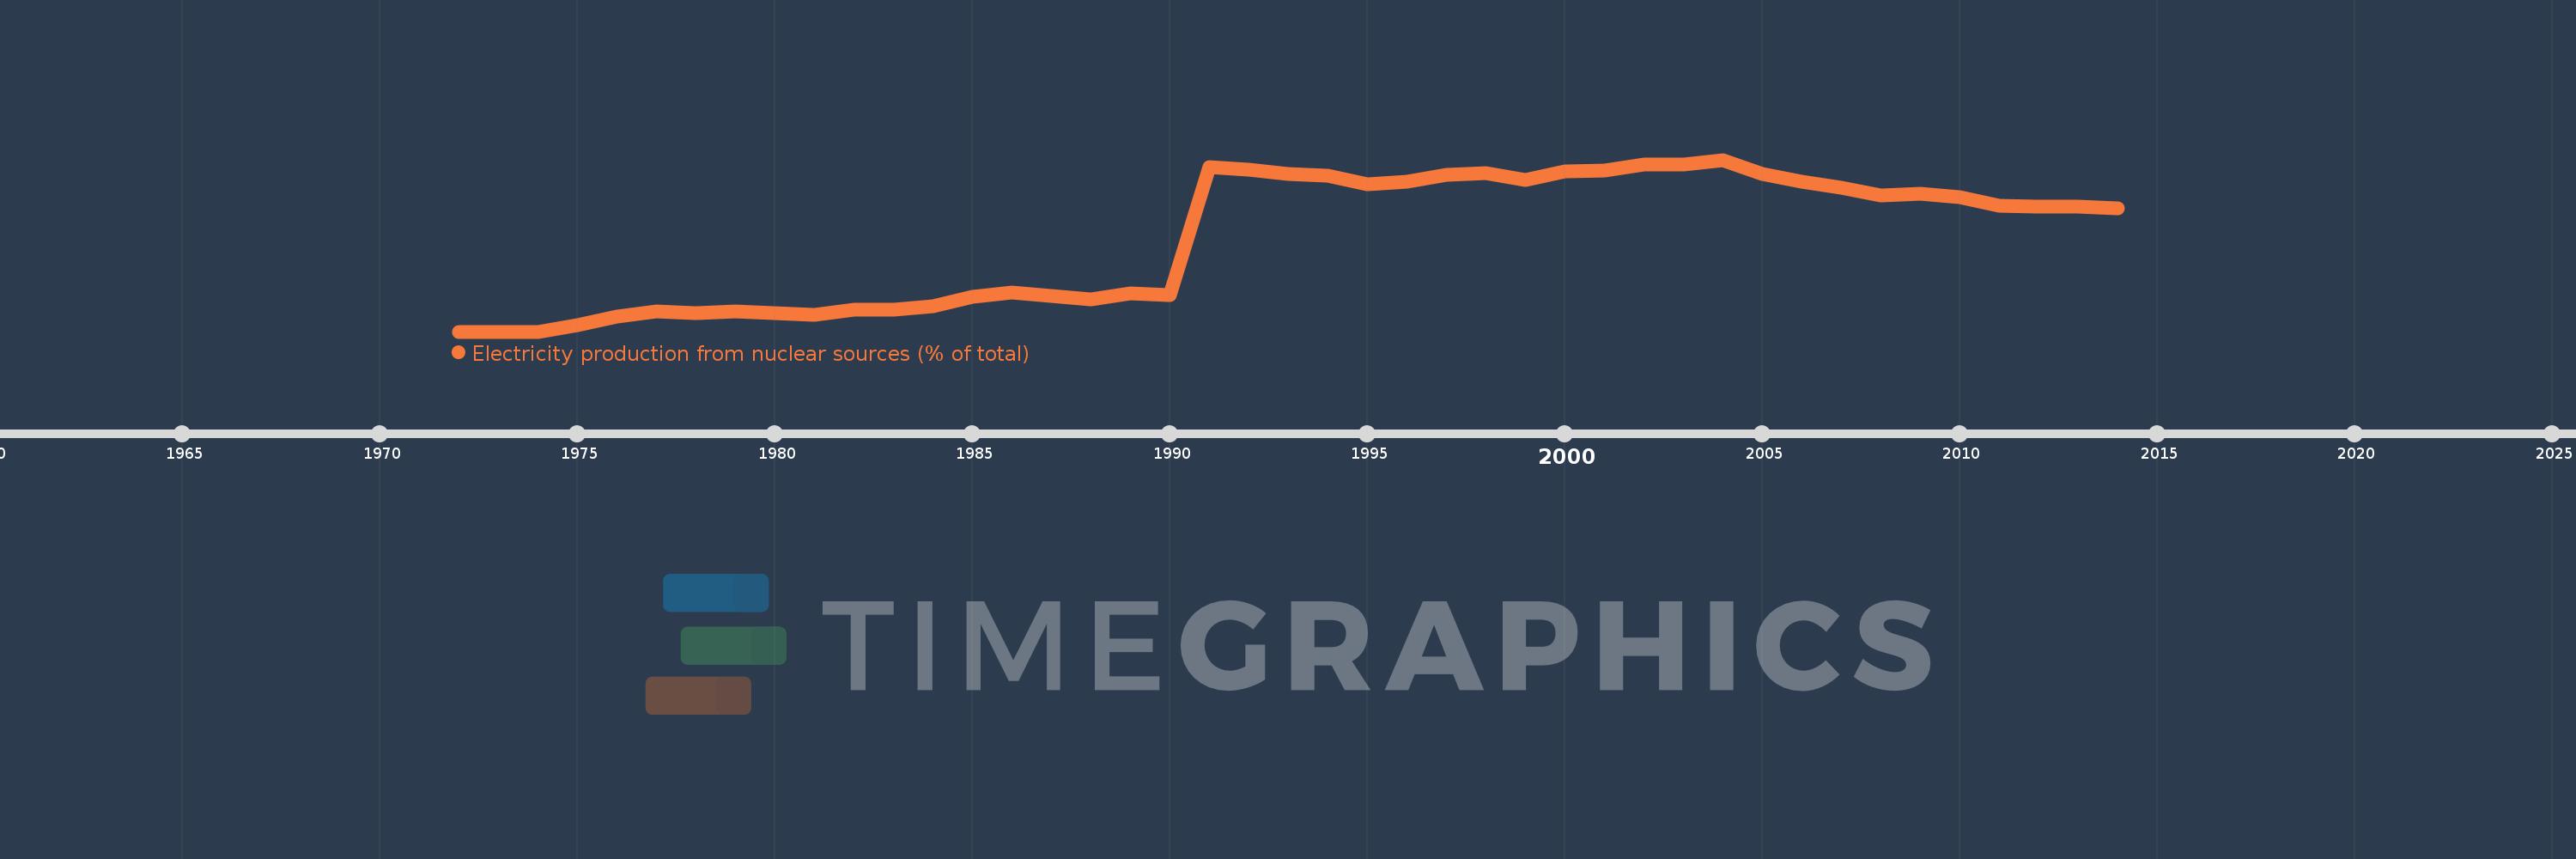
Electricity production from nuclear sources (% of total)
2014,2013,2012,2011,2010,2009,2008,2007,2006,2005,2004,2003,2002,2001,2000,1999,1998,1997,1996,1995,1994,1993,1992,1991,1990,1989,1988,1987,1986,1985,1984,1983,1982,1981,1980,1979,1978,1977,1976,1975,1974,1973,1972
This statistics in other country:
AlbaniaAlgeriaAngolaArab WorldArgentinaArmeniaAustraliaAustriaAzerbaijanBahrainBangladeshBelarusBelgiumBeninBoliviaBosnia and HerzegovinaBotswanaBrazilBrunei DarussalamBulgariaCambodiaCameroonCanadaCentral Europe and the BalticsChileChinaColombiaCongo, Dem. Rep.Congo, Rep.Costa RicaCote d'IvoireCroatiaCubaCuracaoCyprusCzech RepublicDenmarkDominican RepublicEarly-demographic dividendEast Asia & PacificEast Asia & Pacific (excluding high income)East Asia & Pacific (IDA & IBRD countries)EcuadorEgypt, Arab Rep.El SalvadorEritreaEstoniaEthiopiaEuro areaEurope & Central AsiaEurope & Central Asia (excluding high income)Europe & Central Asia (IDA & IBRD countries)European UnionFinlandFragile and conflict affected situationsFranceGabonGeorgiaGermanyGhanaGibraltarGreeceGuatemalaHaitiHeavily indebted poor countries (HIPC)High incomeHondurasHong Kong SAR, ChinaHungaryIBRD onlyIcelandIDA & IBRD totalIDA blendIDA onlyIDA totalIndiaIndonesiaIran, Islamic Rep.IraqIrelandIsraelItalyJamaicaJapanJordanKazakhstanKenyaKorea, Dem. People’s Rep.Korea, Rep.KosovoKuwaitKyrgyz RepublicLate-demographic dividendLatin America & Caribbean Latin America & Caribbean (excluding high income)Latin America & the Caribbean (IDA & IBRD countries)LatviaLeast developed countries: UN classificationLebanonLibyaLithuaniaLow & middle incomeLower middle incomeLuxembourgMacedonia, FYRMalaysiaMaltaMauritiusMexicoMiddle East & North AfricaMiddle East & North Africa (excluding high income)Middle East & North Africa (IDA & IBRD countries)Middle incomeMoldovaMongoliaMontenegroMoroccoMozambiqueMyanmarNamibiaNepalNetherlandsNew ZealandNicaraguaNigerNigeriaNorth AmericaNorwayOECD membersOmanOther small statesPakistanPanamaParaguayPeruPhilippinesPolandPortugalPost-demographic dividendPre-demographic dividendQatarRomaniaRussian FederationSaudi ArabiaSenegalSerbiaSingaporeSlovak RepublicSloveniaSmall statesSouth AfricaSouth AsiaSouth Asia (IDA & IBRD)South SudanSpainSri LankaSub-Saharan Africa Sub-Saharan Africa (excluding high income)Sub-Saharan Africa (IDA & IBRD countries)SudanSwedenSwitzerlandSyrian Arab RepublicTajikistanTanzaniaThailandTogoTrinidad and TobagoTunisiaTurkeyTurkmenistanUkraineUnited Arab EmiratesUnited KingdomUnited StatesUpper middle incomeUruguayUzbekistanVenezuela, RBVietnamWorldYemen, Rep.ZambiaZimbabwe Timeline:
This timeline shows a graph from 1972 to 2014 of Upper middle income. No data until 1971. Number of actual observations by date: 43.
Source name:
World Development Indicators
Source organization:
IEA Statistics © OECD/IEA 2014 (http://www.iea.org/stats/index.asp), subject to https://www.iea.org/t&c/termsandconditions/
Categories, topics:
Energy & Mining, Climate Change, Infrastructure
Last updated:
apr 23, 2017
Indicators value changes by year
At the date of observation
Value
Absolute change
Change from previous value
jan 1, 1975
0.197
+0.197
%
jan 1, 1976
0.458
+0.261
132.87%
jan 1, 1977
0.634
+0.176
38.55%
jan 1, 1978
0.581
-0.053
-8.41%
jan 1, 1979
0.619
+0.038
6.52%
jan 1, 1980
0.57
-0.049
-7.87%
jan 1, 1981
0.507
-0.063
-11.0%
jan 1, 1982
0.677
+0.17
33.45%
jan 1, 1983
0.674
-0.003
-0.45%
jan 1, 1984
0.793
+0.118
17.57%
jan 1, 1985
1.071
+0.278
35.08%
jan 1, 1986
1.21
+0.139
13.02%
jan 1, 1987
1.091
-0.119
-9.86%
jan 1, 1988
0.994
-0.096
-8.84%
jan 1, 1989
1.182
+0.188
18.89%
jan 1, 1990
1.123
-0.059
-5.0%
jan 1, 1991
5.082
+3.959
352.51%
jan 1, 1992
5.008
-0.074
-1.45%
jan 1, 1993
4.88
-0.127
-2.54%
jan 1, 1994
4.813
-0.068
-1.38%
jan 1, 1995
4.568
-0.245
-5.09%
jan 1, 1996
4.647
+0.08
1.75%
jan 1, 1997
4.835
+0.187
4.03%
jan 1, 1998
4.898
+0.064
1.32%
jan 1, 1999
4.681
-0.217
-4.43%
jan 1, 2000
4.949
+0.268
5.72%
jan 1, 2001
4.97
+0.021
0.42%
jan 1, 2002
5.155
+0.186
3.74%
jan 1, 2003
5.178
+0.022
0.44%
jan 1, 2004
5.313
+0.136
2.62%
jan 1, 2005
4.87
-0.444
-8.35%
jan 1, 2006
4.631
-0.238
-4.89%
jan 1, 2007
4.454
-0.177
-3.83%
jan 1, 2008
4.209
-0.245
-5.5%
jan 1, 2009
4.258
+0.049
1.15%
jan 1, 2010
4.163
-0.095
-2.24%
jan 1, 2011
3.889
-0.274
-6.58%
jan 1, 2012
3.868
-0.02
-0.52%
jan 1, 2013
3.856
-0.013
-0.33%
jan 1, 2014
3.807
-0.049
-1.26%
Ranking of countries by current statistics by years


Comments: